Development of a Geographic Information System for the Near-Real-Time Management of the seismic risk. Case study: The city of Mytilene, Lesvos (Greece)
E. Bouranta*, J.N. Hatzopoulos
1University of Aegean, Department of the Environment, University Hill, 81100 Mytilene, Greece.
RReceived Date: June 15, 2025; Accepted Date: June 26, 2025; Published Date: July 04, 2025;
*Corresponding author: E. Bouranta, University of Aegean, Department of the Environment, University Hill, 81100 Mytilene, Greece. Telephone: 6973855260; E-mail: bourant_e@yahoo.gr, bouranta@webmail.aegean.gr
Citation: BourantaE HatzopoulosJN (2025); Development of a Geographic Information System for the Near-Real-Time Management of the seismic risk. Case study: The city of Mytilene, Lesvos (Greece); Enviro Sci Poll Res and Mang: ESPRM-172
DOI: 10.37722/ESPRAM.2025103
Abstract
Mytilene is the capital of Lesvos, the largest island in the North Aegean. The region of North Aegean is a geotectonically complex area because its geodynamic status is directly affected by the North Anatolian Fault Zone. Seismic activity negatively impacts the material and technical infrastructure and, by extension, social and economic life. This fact makes mitigation of negative impacts of seismic events imperative. This paper describes the development of a web-based GIS for disaster response in Mytilene, Lesvos (Greece), urban area through the ArcGIS Online application (https://www.esri.com ). WebGIS technologies offer a comprehensive range of solutions for fault mapping, data analysis, and the publication of results. The completion of this project contributes to the improvement of methodologies and applied technologies, as well as the proposal and development of new ones, indicating the direction for the implementation of similar research projects and the introduction of new geographic information technologies in seismic risk management.
Information Board
ISSN: 2641-6816
Frequency: Continuous
Format: Video, PDF and HTML
Versions: Online (Open Access)
Language: English
Impact Factor: 4.21
Publish your article not just in PDF and HTML, but also in documentary format. Simply submit your manuscript as usual — we’ll take care of the rest.
Quick Links
Issues
Video Gallery
Guidelines
Publication Fee
Editorial Board
Review Board
Keywords: Earthquakes, emergency management, GIS, Web-based
An earthquake is a highly challenging natural phenomenon to forecast, making each occurrence essential for advancing research (Darzi et al., 2022). Geographic Information System (GIS) can support disaster management as a powerful tool for collecting, storing, analyzing, modeling, and displaying large amounts of data. Online GIS combines the advantages of both GIS and the Internet. The WebGIS is designed for a broad range of end users and supports the implementation of seismic risk mitigation strategies. Web GIS is one of the most widely used technologies for disseminating open data for various purposes. WebGIS technologies have also been widespread for natural risk assessment and communication (Daud et al., 2024).
Furthermore, geographic information systems (GIS) based on WebGIS architectures have transformed the visualization and analysis of geospatial data, offering rapid access to critical information and enhancing decision-making across sectors (Vinueza-Martinez et al., 2024). Furthermore, recent developments in cloud computing, Internet of Things (IoT) technologies, and machine learning have increased the analytical and operational capabilities of WebGIS systems (Safari Bazargani et al., 2021; Liu et al., 2025; Haripavan et al., 2025). Web GIS and geodatabase technologies have been used to advance interactive tools for defining seismic hazard scenarios and risk analysis (Aye et al., 2015; Tehrany et al., 2023). The ArcGIS Online application (https://www.esri.com) helps create interactive maps.
An Earthquake Information Management System (EIMS) is a system that records, collects, keeps, retrieves, and analyzes inputs, produces reports and required information for earthquakes, and informs the responsible stakeholders. The information does not comprise an end but rather contributes to better decisions in policy design, disaster planning, management, monitoring, and evaluation of disaster plans, as well as damage reduction (Ajami & Fattahi, 2009; Kirschenbaum et al., 2017).
Earthquake Information Management Systems (EIMS) use ArcGIS (Geographic Information System) to map and visualize ground vibration, the pattern of damaged buildings, and demographic information about a community (Cao et al., 2023). Once the location and magnitude of an earthquake have been determined, the EIMS will assess the distribution of ground vibrations, building failures, casualties, transmission system failures, power and water outages, population displacement, and the cost of repairing potential faults (Ajami et al., 2008; Cao et al., 2023). In this study, we developed a Web GIS for earthquake management and monitoring in the urban area of Mytilene, Lesvos (Greece). Decision-makers and the general public can use our Web-based GIS model.
Materials and Methods
General description of the analyzed area
Lesvos is the third largest island of the Greek Islands, with 1.632 square kilometers in extent. It is located in the northeastern Aegean Sea. Mytilene is the capital of the island of Lesvos and the Prefecture of Lesvos. The geology can be summarized as a basement composed of Alpidic and pre-Alpidic metamorphic rocks, which were subsequently covered by post-Alpine formations, primarily Miocene volcanic rocks and Neogene marine and lacustrine deposits (Soulakellis et al., 2006). The island was characterized by high seismicity hazards and had been affected many times by powerful, devastating earthquakes. Mytilene is the capital of Lesvos and is located in the eastern part of the island. The altitude fluctuates from 0 to 100 meters, and the relief is smooth.
Methodology
The steps of the methodology include:
Microtremor measurements and processing
Microtremor measurements have been conducted to study the site effect and the site ground response in case of an earthquake in the urban area of Mytilene. The Horizontal-to-Vertical Spectral Ratio (HVSR) technique has been applied to ambient noise measurements (Nakamura’s technique). The Nakamura technique is helpful for subsurface soil structure and site response studies (Araque-Pérez, 2024). The microtremor HVSR method has been widely used in seismic micro-zonation and site effect studies.
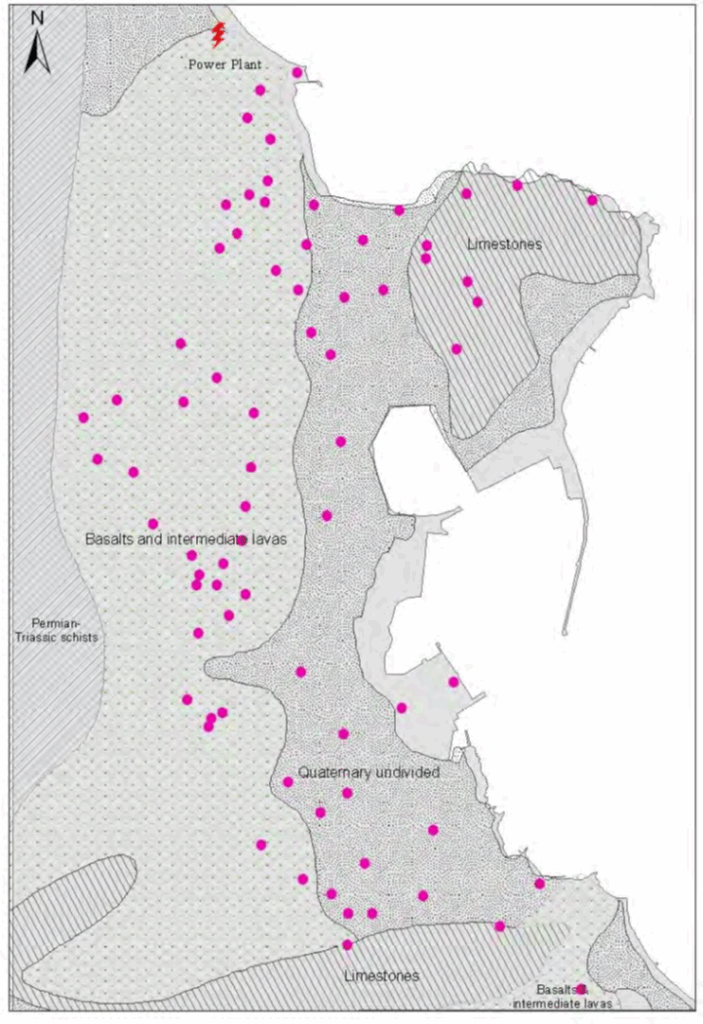
Ambient noise measurements were conducted in Mytilene from May 2012 to February 2013. One hundred measurements of ambient noise have been undertaken throughout the city. The measurements were carried out from Monday to Friday from 23:00-02:30. A global Positioning System (GPS) module localizes the spatial position of each measurement point (Hatzopoulos & Hatzopoulos, 2024). The sampling rate was 200Hz, and the recording duration was 30 minutes. These data are acquired according to guidelines proposed by Duval et al. (2004). The sites of microtremor recordings were selected to cover all the different geological formations of the area. Figure 1 shows the locations of measured points in the urban town of Mytilene.
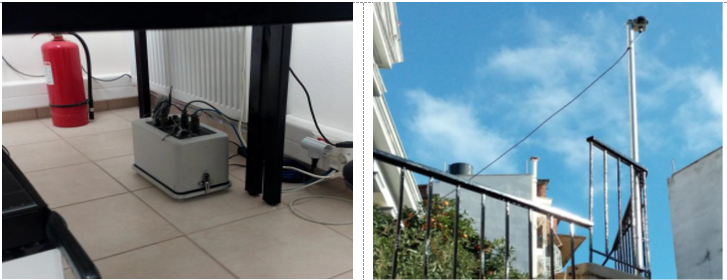
Deployment of temporary strong motion network
A strong motion sensor network was deployed in the three different geological formations to provide valuable information for the region (Fig. 2). A total of 198 seismic events were recorded from December 15, 2014, to July 20, 2015, for the study area.
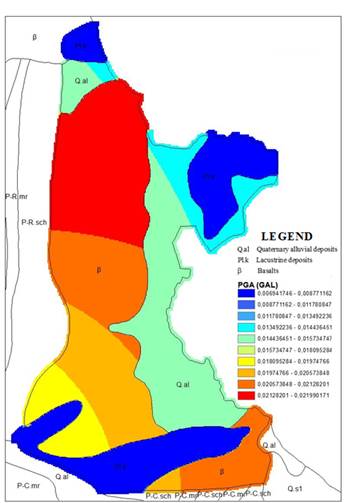
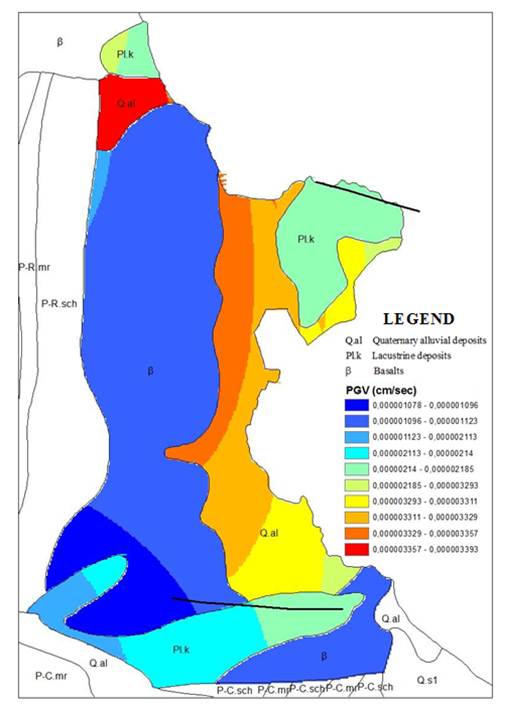
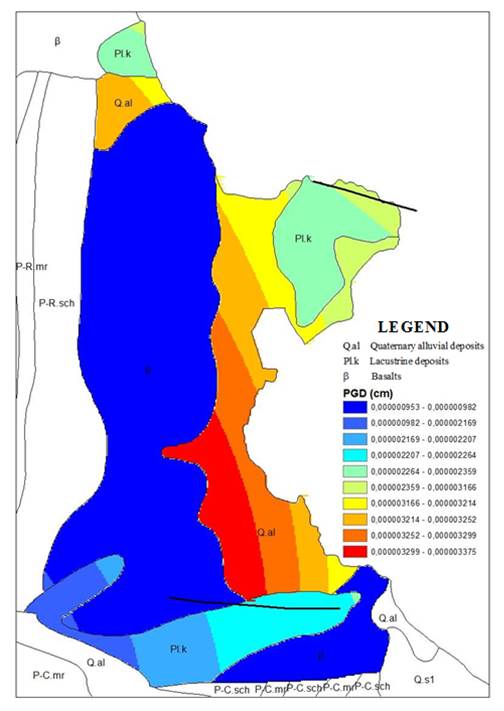
The spatial distribution of the strong motion parameters, such as the Peak Ground Acceleration (PGA), Peak Ground Velocity (PGV), and Peak Ground Displacement (PGD) observed at the urban area of Mytilene are presented with the use of a Geographic Information System (GIS) environment (Figures 3, 4, 5). The results provide valuable information on earthquake hazards before and after detrimental seismic events to supply systems supporting civil protection decisions for prevention and emergency response.
Development of a Web-based interface for earthquake management and monitoring
Finally, dynamic seismic hazard maps were created for the urban complex of Mytilene. Dynamic maps enable the user to manage geoinformation via the Internet. Creating a dynamic map requires the use of a network GIS. (web GIS). This is a GSP that can work and be used on the Internet. Using the ArcGIS Online application (https://www.arcgis.com/home/ ), the corresponding dynamic maps of maximum ground acceleration (PGA), maximum ground speed (PGV), and maximum ground shift (PGD) were created. The application enables the creation of custom cartographic compositions that incorporate user data and allow for the selection of a background.
Results and Discussion
The pilot strong-motion network comprises three stations, which were, however, strategically positioned to represent distinct geological formations. The objective was not to achieve full spatial coverage but rather to evaluate the potential for site-specific, geology-dependent ground response. This approach serves as a foundation for future network expansion. The correlation of recorded motion data with subsurface characteristics provides valuable insights into the spatial variability of seismic site effects.
WebGIS is constantly gaining ground in decision-making and spatial planning applications, as it enables researchers and stakeholders to benefit from the visualization, exchange, and evaluation of geospatial data with minimal effort and cost. Both scientific staff and stakeholders having access to the correct data at the right time can make the right decisions to mitigate the effects and address the risks of an impending earthquake. Thus, an online GIS can be a powerful tool in all phases of a disaster management cycle. The proposed platform distinguishes itself through its focused application at the local scale, effectively integrating in-situ microtremor measurements with real-time strong-motion data. A key innovation lies in its capacity to generate dynamic seismic hazard maps and offer interactive tools designed to serve both technical experts and the broader public, thereby enhancing accessibility and practical utility in risk communication.
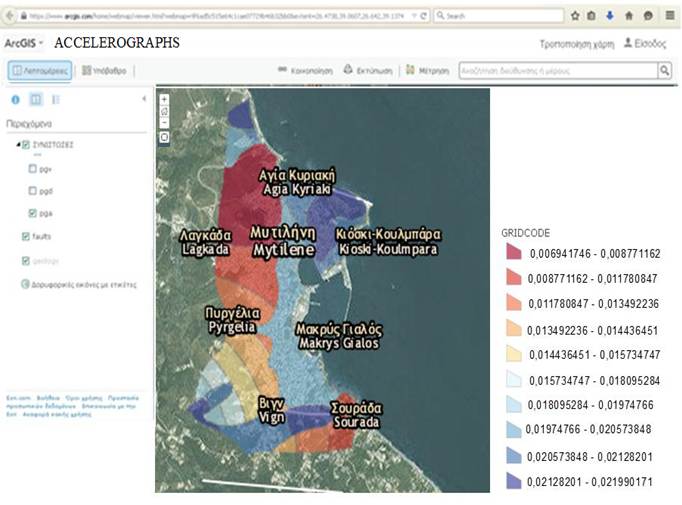
The generated maps of maximum ground acceleration (PGA), maximum ground velocity (PGV), and maximum ground displacement (PGD) indicate the magnitude of damage that an earthquake can cause, depending on the existing local soil conditions. Assessing the effects of an earthquake enables preparedness and immediate response to the crisis in the event of an earthquake. The dynamic maps that are created can be shared via a link. Following the link below provides the user with direct access to dynamic maps: http://arcg.is/1QIlj1X (Fig.6).
Figure 6 is a screenshot of the application, illustrating the interface of the WebGIS application. It shows the PGA map, where users can interactively explore areas of maximum ground acceleration based on different parameters. The map highlights the spatial variation of PGA across the region, helping stakeholders prioritize high-risk zones.
The analysis conducted in this study highlights the criticality of using WebGIS tools for earthquake preparedness and disaster management. For the city of Mytilene, the generated maps indicate specific areas that are more vulnerable to seismic activities due to local soil conditions. In particular, zones with high PGA and PGV values should be given priority in terms of preventive measures and resource allocation. These high-risk areas can guide city planners and emergency response teams in implementing targeted interventions that mitigate potential damage.
Moreover, the findings suggest that immediate attention should be focused on areas with critical infrastructure and dense populations in the event of an earthquake. Prioritizing these areas ensures the safety of residents and the functionality of essential services. The application of WebGIS in identifying and visualizing such zones proves invaluable for proactive planning and efficient disaster response. By integrating real-time data and dynamic maps, stakeholders can make informed decisions that enhance the resilience of Mytilene to seismic hazards.
The obtained results can be a valuable tool for the rational management of seismic risk as they can be applied at any stage of disaster management (mitigation, preparedness, response, rehabilitation). In the future, as far as the online GIS is concerned, this will mainly be addressed to experts and the general public. For this reason, a mechanism could be created to offer solutions to non-skilled people, such as making a discussion forum. Developing an application using open-source or free software could also be addressed to any user, enabling the general public to participate in decision-making processes.
The developed WebGIS system demonstrates strong potential for future scalability and functional expansion. One of its most promising directions lies in the integration of additional datasets, such as detailed building inventory information—including structural typology, construction year, and height—as well as socio-economic indicators like population density, age distribution, and social vulnerability indices. Incorporating such multidimensional data would enable the generation of more sophisticated and realistic seismic risk scenarios tailored to both the physical and human dimensions of urban environments. Furthermore, integrating Building Information Modeling (BIM) technologies with the WebGIS framework could pave the way for a unified risk management platform, combining geospatial intelligence with structural-level detail. This holistic approach would significantly enhance the capacity for pre-event planning, impact assessment, and post-event response in earthquake-prone areas. Also, registering building stock data in an electronic database would enable the creation of seismic risk scenarios, which would serve as a helpful guide for the relevant services. Finally, future enhancements of the system could include the integration of real-time seismic data streams and the application of machine learning for automated damage assessment. Additionally, developing interoperable frameworks that link WebGIS with early warning systems and civil protection databases would significantly improve the region’s ability to respond swiftly and effectively to seismic events.
Overall, this research contributes to the evolving field of earthquake risk management by demonstrating the value of WebGIS in bridging the gap between scientific research and operational decision-making at the local level. The lessons learned from this pilot application can inform the development of similar systems in other seismically active urban areas, thereby advancing the goal of building safer and more resilient communities.
Acknowledgment: Bouranta Evangelia was supported by the Greek State Scholarships Foundation (IKY). The authors would like to express sincere thanks and appreciationto Professor Filippos Vallianatos for his invaluable guidance, insightful feedback, and continuous support throughout the development of this work.
References
- Ajami, S., & Fatahi, M. (2008). Reduce destroys and rule of Earthquake Information Systems: The comparative study in Turkey, Afghanistan and Iran. In Proceedings of the International Disaster and Risk Conference (IDRC) (August 25–29). Davos, Switzerland.
- Ajami, S., & Fattahi, M. (2009). The role of earthquake information management systems (EIMSs) in reducing destruction: A comparative study of Japan, Turkey, and Iran. Disaster Prevention and Management, 18, 150–161.
- Araque-Pérez, C. (2024). Reevaluating soil amplification using multi-spectral HVSR technique in La Chana neighborhood, Granada, Spain. Journal of Seismology.
- Aye, Z. C., Jaboyedoff, M., Derron, M., Westen, C. J., Hussin, H., Ciurean, R. L., Frigerio, S., & Pasuto, A. (2015). An interactive web-GIS tool for risk analysis: A case study in the Fella River basin, Italy. Natural Hazards and Earth System Sciences, 16, 85–101.
- Cao, Y., Xu, C., Aziz, N.M., & Kamaruzzaman, S.N. (2023). BIM-GIS Integrated Utilization in Urban Disaster Management: The Contributions, Challenges, and Future Directions. Remote. Sens., 15, 1331.
- Darzi, A., Bessason, B., Halldorsson, B., Molina, S., Kharazian, A., & Moosapoor, M. (2022). High spatial-resolution loss estimation using dense array strong-motion near-fault records. Case study for Hveragerði and the Mw 6.3 Ölfus earthquake, South Iceland. International Journal of Disaster Risk Reduction, 73, 102894.
- Daud, M., Ugliotti, F. M., & Osello, A. (2024). Comprehensive analysis of the use of Web-GIS for natural hazard management: A systematic review. Sustainability.
- Hatzopoulos, J., D. J. Hatzopoulos (2024). Topographic Mapping. Second Edition. Boca Raton, FL: Universal Publishers.
- Kirschenbaum, A.A., Rapaport, C., & Canetti, D. (2017). The impact of information sources on earthquake preparedness. International journal of disaster risk reduction, 21, 99-109.
- Pessina, V., & Meroni, F. (2009). A WebGIS tool for seismic hazard scenarios and risk analysis. Soil Dynamics and Earthquake Engineering, 29, 1274–1281. https://doi.org/10.1016/j.soildyn.2009.03.001
- Soulakellis, N., Novak, I., Zouros, N., Lowman, P., & Yates, J. (2006). Fusing Landsat-5/TM imagery and shaded relief maps in tectonic and geomorphic mapping: Lesvos Island, Greece. Photogrammetric Engineering & Remote Sensing, 72(6), 693–700.
- Vinueza-Martinez, J., Correa-Peralta, M., Ramírez-Anormaliza, R., Franco Arias, O., & Vera Paredes, D. (2024). Geographic information systems (GISs) based on WebGIS architecture: Bibliometric analysis of the current status and research trends. Sustainability