Effects of fluctuating water volumes on growth performance of Coptodon rendalli fingerlings (Boulenger, 1897)
*Lyson Nakhwala, Austin Mtethiwa, Madalitso Chatsika & Happy Stafford Mvula
*Corresponding author: Lyson Nakhwala, Department of Aquaculture and Fisheries Science, Lilongwe University of Agriculture Natural Resources, Department of Aquaculture and Fisheries Science, Center of Aquaculture and Fisheries Science (AquaFish), P.O. Box 219, Lilongwe, Malawi.
Email: lysonnakhwala@gmail.com
Citation: Nakhwala L, Mtethiwa A, Chatsika M & Mvula-Stafford Happy [2025] Effects of fluctuating water volumes on growth performance of Coptodon rendalli fingerlings (Boulenger, 1897). Jr Aqua Mar Bio Eco: JAMBE-164
DOI: 10.37722/JAMBE.2025301
Abstarct
Optimum water levels of good quality are vital for fish survival, growth and reproduction performance. However, due to erratic rains, climate change, the quantity of water in the fish ponds has been fluctuating over the production season, especially at the end of dry season. This study was conducted to investigate the effects of fluctuating water volumes on the growth performance of Coptodon rendalli fingerling. A total of 180 C. rendalli fingerlings with a mean weight of 3.0±0.10g were randomly stocked in four treatments and replicated three times for 63 days. Water volumes in treatment 1 (T1) and treatment 4 (T4) were maintained at constant volumes of 100% and 60% respectively, throughout the study period, while those of treatment 2 (T2) and treatment (T3) were fluctuated every twenty-one days. It was observed that fish growth was higher in the T1 with the final individual mean weight of 6.75±0.22 g, followed by T2 with a final individual mean weight of 5.48±0.33 g. The lowest final individual mean weight was 4.24±0.15 g in T4, but did not differ significantly (P<0.05) from T3, which had a final individual mean weight of 4.43±0.14 g. The survival rates of fingerlings in all treatments were not significantly different (P<0.05). The study also show that water volumes have an impact on ammonia concentration in culture facilities, whereby T1 reported lower ammonia level concentration of 0.07±0.02 mg/L, but not significant different from T2. T4 reported the highest ammonia concentration of 0.19±0.02 mg/L, but was not significantly different from T3. This suggest that optimum water level is a crucial factor, if a high growth rate of fingerlings is to be achieved. Although fingerlings would still survive, their specific growth rate would be reduced by about 57%, subsequently reducing the final weight by 37%.

Watch the Article in Motion
Introduction
Fish is the major source of affordable dietary animal protein and livelihood for the majority of the population in the world who live below the poverty line (GoM, 2005). In Malawi, fish contributes about 70% of all dietary animal protein and 40% of all protein intake. However, fish intake has been declining in recent years due to declining fish stocks in the natural water bodies (Breuil and Grima, 2014). Fish and its value chain are also a source of income for people worldwide. In Malawi alone, fish contributes about MK2.6 billion (US $24 million) annually, and about 4% of the country’s GDP. Furthermore, it provides more than 60,000 direct jobs and over 500,000 indirect jobs in either fish processing, fish marketing, net making, boat building, and other related activities (Commonwealth/GTZ, 2007). Although fish farming is a promising venture, its production depends on the availability of water. Unfortunately, in Malawi, rainfall is the major source of water for various agricultural activities, which only comes from November to April, leaving the rest of the months dry and idle (Jamu and Chimatiro, 2004). During the dry months, aquaculture is faced with water volume and quality fluctuations as a result of erratic rainfall. Hence, the pond’s water levels fluctuate seasonally between maximum levels, usually at the end of the rainy season, and minimum levels at the end of the dry season (White et al., 2008; Halim et al., 2017). Slower growing species, such as brown trout (Salmo trutta) and tilapia, are particularly vulnerable to fluctuating water levels during the production cycle (Flodmark et al., 2004).
Coptodon rendalli is one of the important fish species in Malawi and its culture is emerging both in the pre-urban and urban areas (Masuda et al. 2004). Fluctuation of the pond’s water volume, which is associated with change in water quality parameters is a major factor affecting survival and growth of C. rendalli in aquaculture. Water quality parameter such as temperature, dissolved oxygen, carbon dioxide, pH and ammonia are altered with the pond’s water volumes. Consequently, deviation of these water quality parameters from optimum range adversely affects growth and survival rates of the cultured fish (El-Sayed, 2006). The growth rate of
C. rendalli decreases quickly at temperature below 20°C with poor growth recorded at temperature below 15° C (Mjoun et al., 2010). The optimum growth for T. rendalli is achieved at 28°C temperature (Skelton, 2001). Furthermore, the level of un-ionized ammonia, which have an impact on fish production and can cause high mortality over a few days is ranged between 0.2 and 0.6 mg/L (Joel and Amajuoyi, 2010). The toxicity of ammonia is influenced by concentration of dissolved oxygen, carbon dioxide and pH which are exacerbated by fluctuation in the pond’s water volumes. The toxicity increases with decreasing dissolved oxygen and pH and decreases with increasing carbon dioxide. This is due to the fact that increase in carbon dioxide leads to the formation of carbonic acid which decreases the pH of the water leading to the form of unionized form of ammonia. For optimum growth of fingerling, the ammonia (NH3) concentration below
0.05 mg/L are recommended (El-Sayed, 2006). Furthermore,
C. rendalli is known to withstand very low levels of dissolved oxygen (as low as 3mg/L). However, best fingerling growth performance is achieved when the dissolved oxygen is above 6mg/L. Low survival occurs when dissolved oxygen become less than 2 mg/L for more than 24–72 hours consecutively (Chervinski, 1982). Hence, pond water levels must be kept constant at the recommended depth to avoid deviation of these water quality parameters from the optimum range.
Good quality fingerlings contribute significantly to optimum fish growth and survival which eventually determine the fish yield. Whilst a considerable number of studies have been done on the impact of pond depth as well as water volume on quality of fingerling, there is hardly no study on the effects of fluctuations in water volumes, which may occur during the production period of C. rendalli fingerling on their growth and survival rates. Considering the importance of quality fingerling in any aquaculture venture, it was important that the present study must be conducted to determine the role of fluctuating water volumes on the quality of the fingerling, which is an important determinant of fish quality and yield in aquaculture production.
Materials and methods
Study area
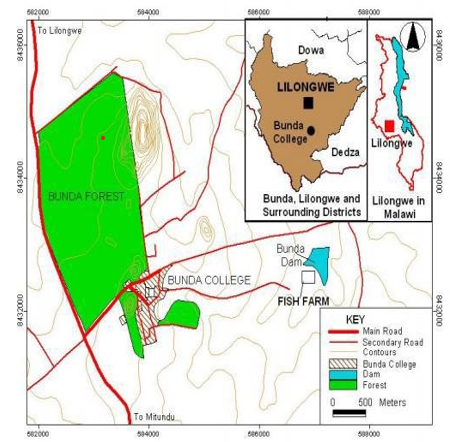
The study was conducted at the Lilongwe University of Agriculture and Natural Resources (LUANAR), Bunda campus, Aquaculture and Fisheries wet laboratory, Lilongwe, Malawi for a period of 63 days (Figure 2).
Fingerling collection, conditioning and stocking
A total of 180 fingerling of mixed sexes of initial average weight of 3.0±0.10 g were collected from Bunda fish farm. Fingerling were stocked randomly and acclimatized for a week in the experimental tank before commencement of the study. A total of 15 fingerling were stocked in each experimental tank, making a total of to 45 fingerlings per treatment.
Experimental layout and treatments
The experiment was laid out in a Completely Randomized Design (CRD) with four treatments (denoted T1, T2, T3 and T4) replicated three times. Twelve tanks, measuring 0.1m3 were filled with water drawn from the same one source to ensure there was no disparity in terms of water quality. Treatment 1 (T1) and Treatment 4 (T4) had a constant (not fluctuated) water volume of 0.1m3 and 0.06m3 respectively throughout the experimental period. The water volumes in Treatment 2 (T2) and Treatment 4 were fluctuated. In Treatment 2, water volume was fluctuated from 0.1m3 to 0.06m3 and back to 0.1m3 every after 21 days, whilst in Treatment 3 (T3), water volume was fluctuated from 0.06m3 to 0.1m3 and back to 0.6m3 at every after 21 day. All treatment were aerated using air stones.
Table 2.1 Experimental set up
| Treatment (T) | Volume of water (m3) | ||
| 21days | 42 days | 63 days | |
| 1 | 0.1 | 0.1 | 0.1 |
| 2 | 0.1 | 0.06 | 0.1 |
| 3 | 0.06 | 0.1 | 0.06 |
| 4 | 0.06 | 0.06 | 0.06 |
Fish feeds and feeding
The fingering were fed Bunda feed containing 30% crude protein twice a day i.e., at 0900 hours. to 1400 hours. The fish were fed at 10% of total body weight/per day throughout the study period.
Fish data collection
A total of 30% fingerling were sampled every 21 days per treatment and their individual weight, total length and standard length were measured using an electronic weighing balance and measuring board respectively. Furthermore, initial weight and final body weights, and survival rate of fingerling as well as water quality parameters data were measured from all treatments and all data were recorded then entered in Microsoft® Excel pending foe analysis.
Growth performance
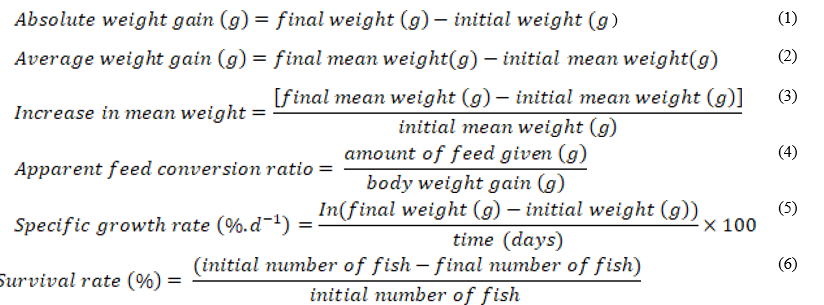
Growth performance parameters of fish was determined by periodically assessing the change in weight (g) as well as length (mm) of the fish and it was determined in accordance with Stickney (1994) using the following formulae.
Water quality parameters
Water quality parameters; temperature and un-ionized ammonia (NH3), were measured throughout the experimental period to establish the water quality of the experimental tanks. Temperature was measured twice daily before feeding using mercury thermometer. Labelled (250 ml) plastic sampling water bottles were used to collect water samples in experimental tanks bi-weekly to measure un-ionized ammonia (NH3) using Indophenole Blue method.
Data analysis
Statistical package IBM SPSS (ver. 20) was used in analysis of data and Microsoft Excel (2019) for Windows was utilized to create graphs. Levene’s and Shapiro-Wilk’ tests were used to test data for homoscedasticity and normality respectively. One-way analysis of variance (ANOVA) was deployed to determine whether significant differences existed between final weight, weight gain, specific weight gain, apparent feed conversion ratio and water quality parameters. When significant differences were found among treatments, Turkey test was used to test differences between treatment means.
Results
Growth performance
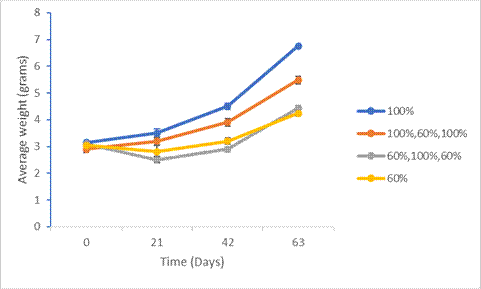
The initial weight of the fish did not differ significantly (P=0.311) among treatments. Results showed that growth was slower in the first four weeks but increased in the subsequent weeks as reflected by the average growth. The significant different was observed after 21 days of stocking fingerling with T1 (100%) be significant different (P<0.012) from T3 (60%, 100%, 60%) but not significant different from T2 (100%, 60%, 100%) and T4. After 42 days of stocking fingering the results showed that T1 was significant different (P<0.001) from T2, T3 and T4, the trend continued up to the end of the study (Figure 3.0).
Results on growth parameters, specific growth rate, apparent feed conversion ratio and survival rate are shown in (Table 3.1). The findings revealed that there was a significant difference (P<0.001) for the final individual mean weight between T1, T2, T3 and T4 (Table 3.1). T1 reported the highest final individual mean weight of (6.75± 0.22 g) followed by T2 (5.48±0.33 g) and T4 reported the lowest final individual mean weight of 4.24±0.15 g. Similar trend was also observed in other growth parameters in all treatments apart from apparent feed conversion ratio, whereby T1 was not significant different (P< 0.714) from T2 (Table 3.1).
Table 3.1 Growth parameters, (Survival, SR and FCR) of C. rendalli and water quality parameters.
| Parameter | T1 | T2 | T3 | T4 | P value |
| Initial weight (g) | 3.15±0.08 a | 2.90±0.10 a | 3.10±0.10 a | 3.04±0.08 a | 0.311 |
| Final weight (g) | 6.75±0.22 c | 5.48±0.33 b | 4.43±0.14 a | 4.24±0.15 a | 0.001 |
| AWG (g) | 3.60±0.28 c | 2.57±0.03 b | 1.33±0.20 a | 1.20±0.21 a | 0.001 |
| AWG-day (g) | 0.06±0.00 c | 0.04±0.00 b | 0.02±0.00 a | 0.02±0.00 a | 0.001 |
| Increase in mean weight (%) | 114.22±9.31 c | 89.32±5.69 b | 42.65±4.94 a | 42.65±4.94 a | 0.001 |
| Specific growth rate | 1.21±0.07 c | 1.01±0.05 b | 0.56±0.05 a | 0.52±0.05 a | 0.001 |
| AFCR | 1.49±0.26 b | 1.83±0.03 b | 3.81±0.28 a | 4.19±0.97 a | 0.001 |
| Percentage survival | 86.67±3.85 a | 82.22±5.57 a | 86.67±7.70 a | 91.11±2.22 a | 0564 |
a Means (±SE) within the same row and followed by the same letter are not significantly (P 0.05). AWG=Average Weight Gain, AFCR= Apparent Feed Conversion Ratio, T=0.1m3(100%),T2=0.1m3(100%)/0.06m3(60%)/0.1m3(100%),T3=0.06m3(60%)/0.1m3(100%)/0.06m3(60%) and T4=0.06m3(60%)
Water quality parameters
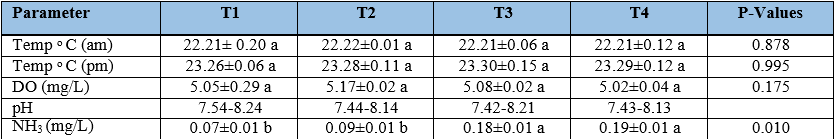
Results shown that there was a significant difference (P <0.05) for ammonia among the treatment. T4 reported the highest ammonia level concentration of 0.19±0.01 mg/L, followed by T3 with ammonia level concentration of 0.18±0.01 mg/L (Table 3.2).
Table 3.2: Water quality parameters.
aT=0.1m3(100%),T2=0.1m3(100%)/0.06m3(60%)/0.1m3(100%),T3=0.06m3(60%)/0.1m3(100%)/0.06m3(60%) and T4=0.06m3(60%)
Discussion
Growth performance
Treatments with constant and optimum water volumes had highest fingerling growth performance than those whose water volumes were fluctuated or were held at 60% volume. This is a reflection of extent of disturbances that fluctuating water volume or reduced water volume would cause to the fish. Reducing water volume without reducing the number of fish stocked automatically increases stocking density since the available space is automatically reduced. Overstocking results into overcrowding of fingerlings. Among the many repercussions of overcrowding in fish is the development social hierarchy among the fish. The social hierarchy results into formation of dominant and subordinate individuals within the culture system. The presence of social hierarchy leads to disproportional consumption of feed where the subordinates are deprived of feeding and mostly starve. The repercussion of this social hierarchy is reflected in the retarded fish growth in the subordinate individuals. It is therefore assumed that the retarded growths observed in Treatments 3 and 4 (Figure 3). In the present study where water volumes were low is as a result of presence of a social hierarchy.
Besides the social hierarchy, higher stocking density creates stress amongst the fish. Studies have shown that increased plasma cortisol concentration is an indicator of stress in fish. In their study, Barcellos et al., (1999) found that at higher stocking densities of O. Niloticus fingerlings, the resting plasma cortisol concentration were significantly increased, an indication of an intense stress response resulting from social interaction. Stress leads to reduced grown as reported by Alanara et al. (1998), who found out that subordinate Arctic char (Salve Linus alpines) that suffered from stress had showed reduced growth. Reducing water volume without reducing the stocking density leads to increased toxins concentration emanating from breakdown of metabolites from the fish. In this study, ammonia, a toxic substance to fish, was significantly higher in the Treatments with fluctuating water volumes and reduced water volumes than in the non-fluctuating ones (Table 3.1). The higher concentration of ammonia created stress on to the fish, affecting its feeding and effective assimilation of the feed as portrayed by higher FCR (Table 3.1). Kuttchantran, (2013) showed that higher ammonia concentrations lead to possible brain malfunctioning and reduction in the oxygen carrying capacity of the blood, reduced resistance to diseases and loss of appetite, which results into reduced fish growth. Similar findings were also reported by Flodmark et al. (2004) who discovered that juvenile brown trout exposed to high stable water level showed higher feed intake and growth than those exposed to fluctuating or low water level.
Furthermore, a metabolic activity such as swimming also influences the rate at which feed is utilized by fingerlings. Fingerlings subjected to low water level are prone to experience low metabolism because they have reduced space to wiggle around, while high water volume increases metabolic activities in fish, hence better feed intake leading to higher growth rate (Ajiboye and Aremu, 2015). Similarly, fluctuating water volumes in aquatic environments deprives the water of optimum oxygen concentrations such that low oxygen concentrations (hypoxia) or lack of oxygen (anoxia) are experienced during these situations. Inadequate Dissolved Oxygen in water can seriously stress or kill the fish (Wetzel, 2001). Studies haves shown that brain cells may start dying less than 5 minutes after their oxygen supply disappears. As a result, brain hypoxia can rapidly cause severe brain damage or death. Apart from causing death, anoxic environments lead to stress and reduced immunity.
Survival of the fish
Survival of the fish was generally high in all the treatments (82.22% to 91.11%) and there were no significance differences amongst the treatments, although treatments with constant water volumes had higher survival rates than those whose water volume was fluctuated. The absence of significance difference in the survival of the fish is an indicator that the 60% reduction in volume of water was not that stressful to case fish kill although it could cause stress on other growth performances. However, it has to be noted that extremely low volumes create stress and results in increased concentrations of solutes, metabolites as well as toxins which may affect the survival of the fish. The findings on this parameter agree with those by Ajiboye and Aremu (2015) who also reported highest survival rate at increasing water volume.
Water quality parameters
Variations were observed in the respective setups of the study though for Ammonia (NH3) concentration which, was higher in T3 and T4. The higher concentration (NH3) is attributed due to reduction in water volume, which could have been used to dilute the metabolite and increases dissolved oxygen concentration. Left over feed and excretes from the fish are the major culprit sources of ammonia in this setup. As such, although all the setups had same number of fish, they had different water volume leading to higher concentration of excretes in setups with low water volumes. Similar observations of higher ammonia concentrations were reported by Hargreaves and Craig (2004) in the managing of Ammonia in ponds. Hydrogen ions have toxic impact on oxygen uptake resulting in acid stress, proteins precipitation within the epithelial cells and acidosis of the blood (Boyd, 1990). It also temperatures were observed during the experiential period as this study was conducted during the slightly cold months of the year. This affected the growth performance of fingering observed in all treatments. Kamal et al., (2010) reported that temperature of higher than 22o C are required to induce tilapia reproduction. In this study growth performance of C. rendalli was affected with a decrease in temperature of less than 22 o C, this is similar to results by above scholar. In this study the pH range was within the recommended range of C. rendalli growth in all treatments. Santhosh and Singh (2007); Stevens (2009), reported that suitable pH range of between 6.7 and 9.5 provides adequate protection for the life of freshwater fish, therefore outside of these range, fish suffer adverse physiological effects.
Conclusion and recommendation
This study has shown that growth performance of the fingerlings of C. rendalli is affected by the quantity and stability of the volume of the water in a culture facility. Optimum growth performance is achieved when optimum water volumes are maintained at constant level (100%). The study has also shown that at 60% water reduction and fluctuation, fingerlings would still survive however, their specific growth rate would be reduced by about 57% and subsequently reducing the final weight with 37%. It is therefore recommended that wherever possible, optimum constant and undisrupted water volumes should be maintained throughout the production cycle of fish to obtain optimum growth rate which will translate into optimum yield.
Acknowledgement: This work was funded by The Lilongwe University of Agriculture and Natural Resources (LUANAR); the authors sincerely appreciate for the support rendered.
Reference
- Ajiboye, A., and A. Aremu. 2015. Effects of water level on growth, nutrient utilization and survival of African catfish, C. gariepinus. International Journal of Agricultural Sciences and Natural Resources, 2(4): 109-112. Available (PDF) Effects of Water Level on Growth, Nutrient Utilization and Survival of African Catfish, Clarias gariepinus (researchgate.net)
- Alanara, A., S, Winberg ., E, Brannas., A, Kiessling., Hoglund, E., and U, Elofsson. 1998. Feeding behavior, brain serotogenic activity levels and energy reserves of Arctic char (Salvelinus alpinus within a dominance hierarchy. Canadian Journal of Zoology, 76(2): 212- 220.
- Barcellos, L.G.J., S, Nicolaiewsky, G., S.G, De Souza M., and F, Luhier . 1999. The Effect of stocking density and social interaction on acute stress response in the Nile tilapia (Oreochromis niloticus) fingerlings.: Aquaculture Research, 30: 11-12: 887-892.
- Boyd, C. E. 1990. Water quality in ponds for aquaculture. Alabama Agricultural Experiment Station, Auburn university, Alabama, p482.
- Breuil, C., and D, Grima, D. 2014. Baseline Report Malawi. Smart Fish Programme of the Indian Ocean Commission, Fisheries Management FAO component, Ebene, Mauritius. 29 pp.
- Chervinski, J. 1982. Environmental physiology of tilapias. In: R.S.V. Pullin and R.H. Lowe-McConell (Eds), ICLARM Conference: topic in the Biology and Culture of Tilapias, Manila, September 1980 (pp. 119–128). Bellagio: WorldFish.
- Commonwealth/GTZ, 2007. ESA Meeting On Trade And Sustainable, Approaches To Fisheries Negotiations Under WTO/EPA, Labourdonnais Waterfront Hotel, Port Louis- Mauritius.
- Flodmark, L.E.W., L.A, L., Vollestad., L. and T. Forseth, T. 2004. Performance of Juvenile Brown Trout Exposed to Fluctuating Water Level and Temperature. Journal of Fish Biology, 65(2): 460-470.
- GoM., 2005., Malawi Poverty Reduction Strategy (MPRS)., Ministry of Economic Planning and Development: Annual Report.
- Halim, M., D.K, Mondal, D., M.A, Salam, and H. M, Shahdat. 2017. Impacts of climate change on pond fish farming in Amtoli, Borguna, Bangladesh. International Journal of Fisheries and Aquatic Studies, 5(2): 38-41.
- Hargreaves, J.A., and C.S, Tucker. 2004. Managing ammonia in fish ponds. Southern Regional Aquaculture Center, Stoneville.4603: 1-7.Hargreaves J and Craig T, (2004), Managing Ammonia in Fish Ponds, SRAC Publication No 4603.
- Jamu, D. and S, Chimatiro. 2004. Contributing to food and nutritional security in a densely populated country: Sustainable agro-pisciculture in Malawi. Entwicklung and Ländlicherraums, 6: 27-28.
- Joel, O., and C.S, Amajuoyi. 2010. Determination of the concentration of ammonia that could have lethal effect on fish pond. Journal of Engineering and Applied Sciences, 5(2): 1-5.
- Kamal, M., A, Kurt and L.B, Michael. 2010. Tilapia profile and economic importance. SDSU Extension Fact Sheets. 163. USA: Cooperative Extension Service, South Dakota State University.
- Kuttchantran, M. 2013. Managing ammonia in fish ponds. Aquatic animal health unit: Universiti Putra Malaysia, Malaysia.
- Masuda, K,. B, Chirwa and G, Ntenjera. 2004. A contribution to the development of rearing techniques in fish farming in Malawi. NAC and JICA: 146.
- Mjoun, K., K, Rosentrater and M.L, Brown. 2010. “TILAPIA: Profile and Economic Importance”). Fact Sheets. Paper 163.
- Santhosh, B., and N.P, Singh. 2007. Guidelines for water quality management for fish culture in Tripura. ICAR Research Complex for NEH Region, Tripura Center, no.29.
- Stevens, R. 2009. Fish Pond Water Quality: As Simple as Chemistry 101. Noble Research Institute. Available at https://www.noble.org/news/publications/ag-news-and- views/2009/july/fish-pond-water-quality-as-simple-as- chemistry-101/.
- Stickney, R.R. .1994. Principles of aquaculture. New York: John Wiley and sons, Inc. : 502.
- White, M., M, Xenopoulos., K, Hogsden., R, Metcalfe and P, Dillon. 2008. Natural lake level fluctuation and associated concordance with water quality and aquatic communities within small lakes of the Laurentian Great Lakes region. Hydrobiologia, 613: 21-31.
- Wetzel, R. 2001. Limnology; lake and river ecosystems, Third 3rd ed., Academic Press New York 1006 ppElsevier, Newyork.