Detection of Carbapenemase-Encoding Genes in Wastewater Samples by real-time PCR
Katharina Helmke2, Jessica Kuru1,2, Ole Huesing2, David Drissner1
Citation:Helmke K, Kuru J, Huesing O, Drissner D (2026); Detection of Carbapenemase-Encoding Genes in Wastewater Samples by real-time PCR; Enviro Sci Poll Res and Mang: ESPRM-189
DOI: 10.37722/ESPRAM.2026203
Abstract
The spread of antibiotic-resistant bacteria (ARB) poses a serious challenge, having directly caused 1.27 million deaths around the world in 2019, and contributed to 4.95 million (Murray et al. 2022). The introduction of routine diagnostics for the detection of antibiotic resistance genes (ARG) in wastewater could be a major opportunity for the surveillance of and decision-making regarding the spread of ARB and ARG. As wastewater monitoring has already been established for the detection of pathogenic viruses, like SARS-CoV-2 and influenza virus, it could also be used to implement timely actions to protect the population from this so-called silent pandemic. The aim of this study was to conduct a qualitative analysis of wastewater samples from Germany for five carbapenemase-encoding genes. The experiments were performed using real-time polymerase chain reaction (PCR) in a biosafety level 2 laboratory. The PCR results showed that the samples contained multiple genes encoding for antibiotic resistance.
Watch the Article in Motion
Authors:

Katharina Helmke
Keywords: Antibiotic resistance; antibiotic resistance genes; bacteria; Enterobacteriaceae; wastewater; carbapenems; carbapenemase; Real-Time PCR;
Introduction
The spread of Antimicrobial Resistance (AMR) in bacteria represents a major challenge in the treatment of bacterial infectious diseases and was estimated to cause millions of deaths every year (Murray et al., 2022).
Carbapenems play an important role as last-resort antibiotics and are used in severe infections commonly caused by Gram-negative bacteria. Carbapenem resistance causes high morbidity, mortality and healthcare costs (Das, 2023; Nordmann et al., 2011; Ramirez et al., 2020). Surveillance of antibiotic resistance in animal, environmental and food sectors is essential, although often overlooked, and surveillance of the spread of ARB and carbapenem-resistant bacteria in particular is urgently required (Bonomo et al., 2017; Das, 2023). The detection of carbepenemase-encoding resistance genes in wastewater can be considered an indicator of the prevalence of antibiotic resistance in a region, but can also show the risk of further spread of these genes by transmission between bacteria in the environment (Andersson and Hughes, 2017; Fahrenfeld and Bisceglia, 2016; Poirel et al., 2005; Uluseker et al., 2021). This is especially true in water that is purified in wastewater treatment plants and discharged into rivers and other aquatic systems (Bonetta et al., 2023; Ju et al., 2019; Keely et al. 2022).
Due to the increasing spread of AMR, many countries have launched ARG surveillance programs in several matrices and so in wastewater (e.g. DANMAP, WHO GLASS, EU-WISH etc.). Buelow et al., (2018), Proia et al., (2018), Szekeres et al., (2017) and Rodriguez-Mozaz et al., (2015) detected high concentrations of ARGs, particularly carbapenemase genes OXA-48-like, NDM and VIM, in hospital wastewater and in the inflow of sewage treatment plants in various European countries.
The most common carbapenemases in the medical setting include Klebsiella pneumoniae carbapenemase (KPC), Verona integron-encoded metallo-β-lactamase (VIM), New Delhi metallo-β-lactamase (NDM) and oxacillinase (OXA-48-like) (Munita and Arias, 2016; Queenan and Bush, 2007).
Although numerous studies have detected ARG and particularly carbapenemase genes in wastewater by different techniques like metagenomic analysis or sequencing or other techniques with different primer-probe designs (Brown et al., 2024, Hendriksen et al., 2019, Munk et al., 2022) few commercial kits are currently available for performing a routine qPCR on wastewater samples.
The aim of this study was to investigate whether it is possible to qualitatively detect carbapenemase-encoding genes in wastewater samples using the Carbaplex IVD Real-Time PCR Kit from Bruker, which was originally developed for detection of carbapemenemases in rectal swabs. The experiments are intended to help establish possible routine diagnostics for carbapenemases in wastewater.
blaOXA-48 was included due to its widespread dissemination among Enterobacterales in Europe, whereas blaNDM and blaKPC are associated with numerous international outbreaks and rapid global spread. blaVIM and blaIMP represent clinically relevant metallo-β-lactamases that continue to be reported in healthcare settings worldwide. Together, these targets cover the major carbapenemase families currently contributing to carbapenem resistance and therefore provide a comprehensive framework for wastewater-based AMR surveillance.
The selected carbapenemase genes not only represent clinically important resistance determinants but are also regarded as suitable indicators for wastewater-based epidemiology because their occurrence reflects the community-level burden and dissemination of carbapenem-resistant bacteria. Tracking these markers in wastewater may therefore support early detection of changing resistance trends and complement established clinical surveillance systems (Fahrenfeld and Bisceglia, 2016; Hendriksen et al., 20219; Munk et al., 2022).
Material and Methods
Sampling was carried out by the wastewater treatment plants according to the “Technical guideline part 1 for SARS-CoV-2 wastewater surveillance – sampling of wastewater” of the AMELAG project (Marquar et al., 2024). Raw wastewater samples from municipal wastewater treatment plants (WWTP) connected to cities ranging from 100.000 to 300.000 inhabitants in Baden-Wuerttemberg and the Saarland were taken between October 2023 and December 2024 from after the grit chamber, but before the addition of chemicals or precipitants. Samples of approximately three to five liters were taken twice a week as a 24-hour composite sample using an automatic composite sampler. Approximately 1 liter of chilled raw wastewater was delivered to the laboratories. The wastewater samples were prepared for real-time PCR in the same way for both the detection of SARS-CoV-2 RNA and the detection of carbapenemase-encoding genes, according to technical guidelines (Marquar et al., 2024).
After recording their temperature, wastewater samples were processed further (Error! Reference source not found.). A polyethylene glycol sodium chloride (PEG-NaCl) solution containing 25% PEG 8000 and 5.6% NaCl was prepared. The bottle was placed on a magnetic stirrer and then refilled to the 1 L mark with phosphate-buffered saline (PBS) buffer (pH 7,4). The solution was stirred until all PEG and NaCl were completely dissolved. The wastewater sample bottles were homogenized by being shaken manually for approximately five seconds. Then, 50 mL of the sample was transferred to a centrifuge tube. In addition to the specified samples, additional controls were prepared and analyzed to track the laboratory process. These controls consisted of a wastewater control, a positive control, and a blank. For the wastewater control, a sample obtained from previous analyses was used that had tested negative for SARS-CoV-2. The positive control (P+) consisted of molecular biology-grade water (RNAse and DNAse free) and 10 µL of murine Norovirus (MNV), while the blank sample consisted exclusively of nuclease-free water. MNV as an RNA virus was used in the present work as the whole process here is related to a larger project on the detection of pathogenic viruses in wastewater as part of the AMELAG project. In this context RNA extraction from wastewater samples was carried out prior to PCR analyses for carbapenemases. Once all samples and controls were filled, 10 µL of MNV was added as a process control using a multistepper pipette.
Samples and controls were centrifuged for 10 min at 4,980 g at 4 °C. 10 mL of PEG-NaCl solution was poured into new centrifuge tubes. The supernatant of the centrifuged tubes from the wastewater samples was transferred to the reaction vessels prepared with the mentioned PEG-NaCl solution. The target volume was 50 mL, consisting of 10 mL of PEG-NaCl solution and 40 mL of wastewater. Care was taken to ensure that the pellet did not dissolve and adhere to the bottom. Tubes were then homogenized in a shaker at 4 °C for 30 min at 180 rpm. The remaining wastewater containing the pellet was transferred to a 1 L glass bottle, autoclaved and disposed.
The deep-well plates were then prepared for the extraction. The wash buffers used in this step were from the RNAExtractor AE1 kit from Goldstandard Diagnostics according to the manufacturer’s instructions. The plates were pipetted with the amounts specified in the SOP “IPJ-MA 707-951 Sample Preparation for SARS-CoV-2 Precipitation and RNA Extraction” as mentioned above, analogous to Marquar et al., 2024, and stacked on top of each other to avoid contamination during the preparation phase. Finally, the microtiter plate containing elution buffer was also placed on top of the stack and sealed with foil until further use. After 30 minutes of shaking, the tubes were centrifuged for 30 minutes at 4,980 g and 4 °C. The supernatant was discarded, and the centrifuge tubes were centrifuged again for 8 minutes at 4,980 g and 4 °C. Using a 1,000 µL pipette, the remaining liquid was removed without touching the pellet. Lysis buffer, to which carrier RNA has been added, was pipetted onto the pellets. The pellets were then vortexed to dissolve them in the lysis buffer. The bench was then decontaminated using RNase AWAYTM or a correspondent RNAse inhibitor. The samples and controls were pipetted into a new deep-well plate at the predetermined locations according to the pipetting scheme. The King Fisher Flex (an automated extraction system from Thermo Fisher scientific) was immediately loaded with the plates according to the extraction protocol, and then started. After a 10 minutes lysis phase to release the genetic material, an ethanol solution containing magnetic beads was added to each sample and control well. This allowed for transfer for further purification in various wash buffers. After addition, the plate was placed back into the King Fisher Flex and the program continued. Once the extraction was completed, the microtiter plate was removed, sealed with foil and either used immediately or stored in a -80°C ± 5 °C freezer until PCR was performed.
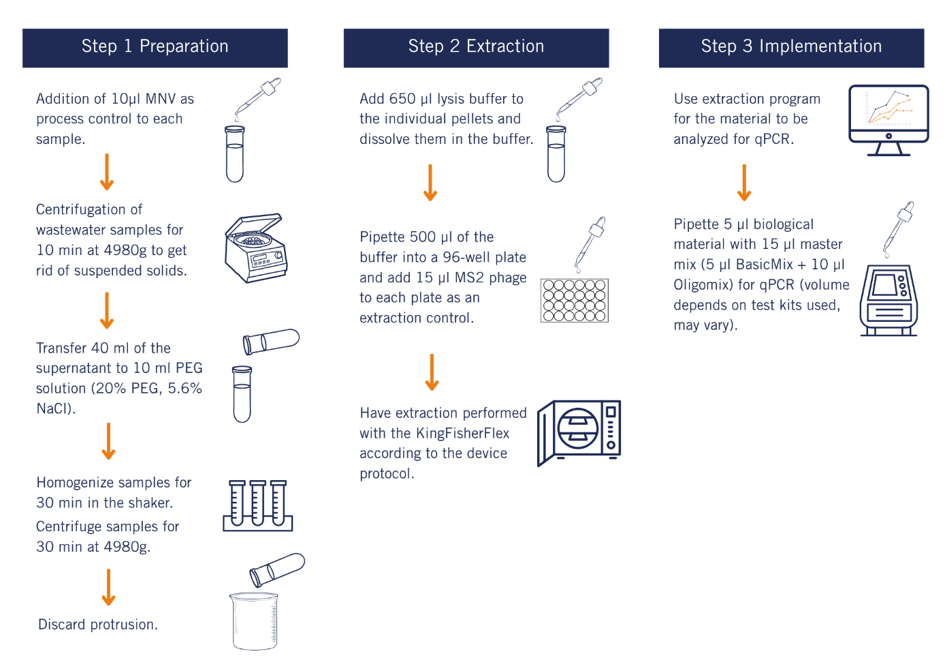
Samples were tested using real-time-PCR with the Bruker Carbaplex™ kit.
Samples that had previously been tested for SARS-CoV-2 by PCR analysis were selected for the experiments. The plate containing samples extracted and tested by PCR is referred to here as plate 1. Additional samples came from plate 2, which were also extracted and tested. After testing they were stored in a freezer at -80 ± 5 °C until further processing. Three samples were selected from plate 1. These included one sample that tested positive for SARS-CoV-2 and two negative samples. The samples on plate 2 contained five positive and two negative samples. For the analyses included in this work, triplicates were chosen. Experiment 1 comprised 12 samples per PCR run. Since three wells per sample had to be considered due to the triplicates, the total number of wells used was 36. The PCR was performed according to the volume and temperature profile in the manufacturer’s manual. The exact composition of the master mix was determined according to the manufacturer’s instructions. In experiment 1, the volumes calculated are shown in Table 1 and Table 2 in the Appendix.
The pipetting scheme is shown in
Table 3 in the Appendix.
Since the AriaDx Cycler from Agilent was not validated by Bruker, the threshold for the individual color channels were manually adjusted so that they were at approximately 2/3 of the exponential phase before the linear working range began. Color channels and thresholds, set manually, are shown in Error! Reference source not found. (experiment 1) and Error! Reference source not found. (experiment 2) in the Appendix.
Results and Discussion
Based on the results presented in Error! Reference source not found., it can be seen that samples 1, 3, 4, 5, 6 and 8 all tested positive for KPC-, NDM- and OXA-48-like (Error! Reference source not found.) genes. Sample 2 was positive for genes encoding NDM and OXA-48-like carbapenemase according to Erler et al., 2024, Proia et al., 2018 and Szekeres et al., 2017, who determined different carbapenemase-encoding genes in several wastewater samples.
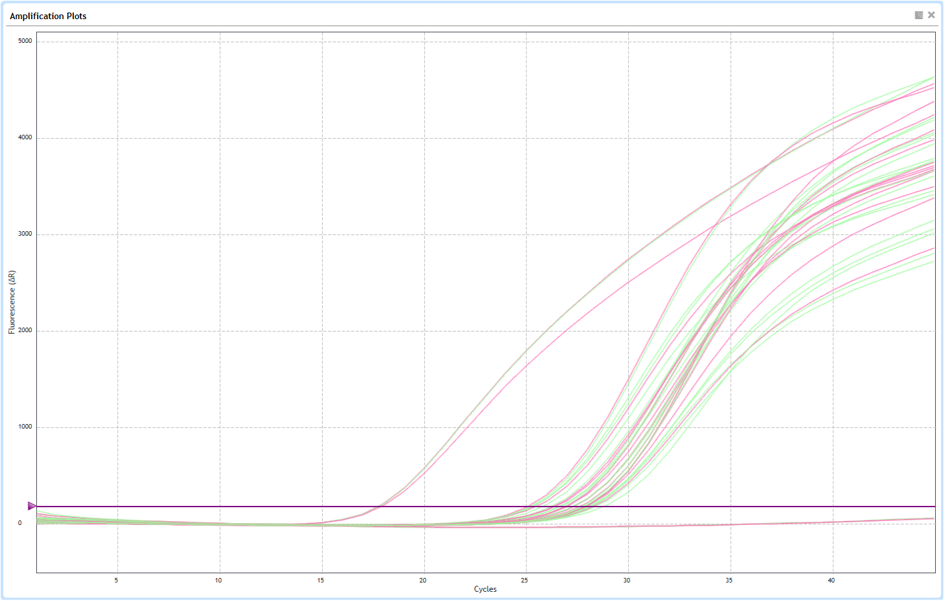
Since two of three values for samples 7 and 10 were reported as “No Cq” and two of the values showed a Cq value of 35,60 and 37,27, it can be assumed that these samples contained only very small amounts of genes encoding Klebsiella pneumoniae carbapenemase. Furthermore, sample 9 tested negative for the NDM gene. The results of experiment 1 for Master Mix 2 carbepenemase genes IMP and VIM are shown in Error! Reference source not found. in the supplement information. All samples have been tested positive for IMP and VIM genes with average Cq values between 25,90 (sample 9) and 33,27 (sample 7) for IMP and between 24,86 (sample 4) and 34,16 (sample 7) in average for VIM.
Ramos et al., 2024 identified a correlation between antibiotic use and the relative frequency of resistance in wastewater. A cluster of β-lactam resistance was detected after the use of carbapenems in hospitals in Portugal. And Szekeres et al., 2017 detected high ARG concentrations in wastewater on similar pattern to antibiotic detection. Brown et al., 2024 confirmed, that the amount of ARGs detected in wastewater was influenced by antibiotic concentration levels in wastewater and Klümper et al., 2019 pointed out, that the strength of antibiotic selection pressure in wastewater could also be influenced by community complexity but not only by antibiotic concentration.
Furthermore, Munk et al., 2022 pointed out, that there is local predominance of different carbapenemase-producing Enterobacteriaceae isolated from clinical samples. While OXA-48-like genes have been shown as the dominant gene especially in European countries (Proia et al., 2018, Szekeres et al., 2017), NDM gene has been found to be more frequent in India (Mariappan et al., 2017), and KPC was dominant in the USA (van Duin et al., 2020).
The widespread detection of carbapenemase genes observed in this study is consistent with findings from wastewater surveillance studies conducted in other regions. In several European countries, including Spain, Romania, Switzerland and Germany, blaOXA-48-like, blaNDM and blaVIM have repeatedly been identified in hospital wastewater, municipal wastewater and wastewater treatment plant influents, highlighting the widespread environmental dissemination of clinically relevant carbapenem resistance determinants (Rodriguez-Mozaz et al., 2015; Szekeres et al., 2017; Proia et al., 2018; Zurfluh et al., 2017).
The frequent detection of blaOXA-48-like genes in the present study is particularly consistent with European epidemiological patterns, where OXA-48-producing Enterobacterales have become one of the dominant carbapenemase groups in both clinical and environmental settings (Proia et al., 2018; Erler et al., 2024). Similar observations have also been reported from Germany, where carbapenemase-producing Gram-negative bacteria carrying blaNDM, blaVIM and blaOXA-48 were detected along the wastewater pathway from hospitals to receiving surface waters (Müller et al., 2018).
Although direct comparison between studies is limited by differences in sampling strategies, wastewater characteristics and analytical methods, the overall agreement between our findings and previous reports supports the use of wastewater surveillance as a valuable tool for monitoring regional and global trends in antimicrobial resistance dissemination.
Table 1: Results of the PCR for master mix 1 by AriaDX, values in Cq. Most of the samples showed detection of carbapenemase genes, and lower Cq have been found for OXA-48-like genes. IC = internal control, a PCR control that is added by the manufacturer to the mastermix and determines if a PCR reaction occurred. It can have high values if there is inhibition present. Every well used for the PCR should have a value for the IC (including NTC). C+ = positive control with standard material provided by the manufacturer to see how a positive PCR reaction would look like. NTC = negative template control that is used as a contamination control for the used mastermix. C+ is only used as control for the step of the PCR, P+ is used as matrix control for the preparation steps in the process.
| Samples | Cq IC Trip. 1 | Cq IC Trip. 2 | Cq IC Trip. 3 | Cq KPC Trip. 1 | Cq KPC Trip. 2 | Cq KPC Trip. 3 | Cq NDM Trip. 1 | Cq NDM Trip. 2 | Cq NDM Trip. 3 | Cq OXA-48 Trip. 1 | Cq OXA-48 Trip. 2 | Cq OXA-48 Trip. 3 |
| C+ | No Cq | No Cq | No Cq | 19.81 | 19.72 | 19.95 | 19.74 | 19.77 | 19.88 | 17.18 | 17.19 | 17.3 |
| NTC | 28.67 | 28.72 | 28.96 | No Cq | No Cq | No Cq | No Cq | No Cq | No Cq | No Cq | No Cq | No Cq |
| 1 | 29.66 | 29.71 | 29.46 | 36.04 | 34.54 | 35.38 | 34.18 | 34.1 | 34.01 | 26.64 | 26.66 | 26.65 |
| 2 | 29.26 | 28.68 | 29.28 | No Cq | No Cq | No Cq | 31.57 | 31.52 | 31.8 | 27.55 | 27.28 | 27.37 |
| 3 | 29.81 | 29.56 | 29.62 | 31.14 | 31.34 | 31.22 | 33.97 | 34.3 | 34.86 | 25.99 | 26.38 | 26.2 |
| 4 | 29.68 | 29.74 | 29.9 | 29.11 | 29.31 | 29.41 | 31.1 | 31.78 | 31.71 | 24.73 | 24.81 | 25.18 |
| 5 | 29.61 | 29.51 | 29.59 | 30.08 | 30.03 | 30.21 | 34.69 | 35.28 | 35.88 | 27.5 | 27.63 | 27.71 |
| 6 | 29.7 | 29.85 | 31.75 | 32.67 | 32.02 | 32.65 | 33.37 | 33.75 | 33.57 | 24.57 | 24.47 | 24.63 |
| 7 | 29.08 | 29.13 | 28.97 | No Cq | 35.6 | No Cq | 35.92 | 36.18 | 36.26 | 27.03 | 27.23 | 27.16 |
| 8 | 29.86 | 29.82 | 29.36 | 32.5 | 32.77 | 35.83 | 36.58 | 39.2 | 36.99 | 25.59 | 25.67 | 28.07 |
| 9 | 29.81 | 28.9 | 28.94 | 36.86 | 34.52 | 34.74 | No Cq | No Cq | No Cq | 26.92 | 27.28 | 27.27 |
| 10 | 28.98 | 29.07 | 29 | No Cq | 37.27 | No Cq | 33.01 | 32.89 | 33.72 | 25.7 | 25.91 | 26.28 |
The internal positive control in experiment 1 (Error! Reference source not found.) did not produce a signal within the FAM channel. However, according to the manufacturer, positive results from the positive control (C+) for KPC-, NDM-, OXA-48-like, IMP- and VIM-encoding genes are to be expected (“Instructions for Use Carbaplex IVD Real-Time PCR Kit,” 2019).
Since a quantitative PCR was performed after the samples were extracted for monitoring to detect the SARS-CoV-2 pathogen load, there was only 5 µL sample material left for samples 6, 7, 8 and 10. This was not enough to pipette the required 10 µL for the final triplicate of the qualitative PCR with Master Mix 2. This resulted in an additional unplanned check, which shows how smaller sample volumes affect the assay results. As can be seen from the values in Error! Reference source not found., the deviations amount to more than the expected 1 Cq value. Looking at the internal control values for Master Mix 2, it can be seen that there are increased deviations here. The differences range from Cq values of 1.19 (sample 1, triplicate 2) to a difference of 3.47 (sample 4, triplicate 1).
Ahmed et al., 2022, found that the complexity of the sample matrix can lead to inhibition in the PCR of wastewater samples. Furthermore, Rahbari et al., 2021, consider it possible that lower amounts of extracted RNA can lead to false negative results. Ambrosi et al., 2021, found that false positive and false negative results also depend on the RNA extraction method. In addition, the use of ddPCR rather than qPCR can also influence the detection of DNA and RNA in terms of sensitivity. Taylor et al., 2017, and Choi et al., 2022 found higher sensitivity with ddPCR in samples with lower nucleic acids (Cq > 29).
Since the manufacturer did not test the kit on wastewater, potential complications as described above could not be predicted. Compared to the internal control for Master Mix 1, only one deviation exceeding 1 Cq value was detected. However, there were some differences for carbapenemase genes in sample 5 for NDM-, sample 8 for KPC-, NDM- and OXA-48-like-, as well as sample 9 for KPC-encoding genes.
All results for the negative control (NTC) were negative. This rules out general contamination of the PCR test kit material.
A further investigation regarding C+ was initiated in the second experiment. The results can be seen in Table 9 in the Appendix.
The curves for samples 5 (SARS-CoV-2 positive) and 10 (SARS-CoV-2 negative) show channels exhibiting smaller Cq value deviations between the triplicates and channels that show differences. It was previously planned to create a standard curve for all experiments using the positive control, which could then be used for quantification. Unfortunately, the manufacturer was unable to provide any information on this, as these are internal specifications. They also observed large fluctuations within the determined concentrations. Since the question arose as to why “No Cq” values were present for C+, a dilution series of the positive control was prepared in the next experiment (see Error! Reference source not found.) to see how the Cq values behave at different dilutions. In this run, no samples were analyzed, only the controls, to initiate a test run that could provide more information about the controls and their behavior in the different master mixes. This also allowed the kit’s sensitivity to be verified at lower concentrations, providing additional useful information. The pipetting scheme for this experiment is shown in the Supplemental Information in
| 1 | 2 | 3 | 4 | 5 | 6 | 7 | 8 | 9 | 10 | 11 | 12 | |
| A | C+ | C+ | C+ | 1 | 1 | 1 | C+ | C+ | C+ | 1 | 1 | 1 |
| B | x | x | x | 2 | 2 | 2 | x | x | x | 2 | 2 | 2 |
| C | NTC | NTC | NTC | 3 | 3 | 3 | NTC | NTC | NTC | 3 | 3 | 3 |
| D | x | x | x | 4 | 4 | 4 | x | x | x | 4 | 4 | 4 |
| E | 9 | 9 | 9 | 5 | 5 | 5 | 9 | 9 | 9 | 5 | 5 | 5 |
| F | 10 | 10 | 10 | 6 | 6 | 6 | 10 | 10 | 10 | 6 | 6 | 6 |
| G | x | x | x | 7 | 7 | 7 | x | x | x | 7 | 7 | 7 |
| H | x | x | x | 8 | 8 | 8 | x | x | x | 8 | 8 | 8 |
Table 7: Thresholds for experiment 1, set manually (values AriaDX program).
| Color channel | Threshold |
| FAM | 36 |
| HEX | 120 |
| ROX | 135 |
| Cy5 | 120 |
Table 8: Thresholds for experiment 2 with dilution series of the positive control (values AriaDX program).
| Color channel | Threshold |
| FAM | 33 |
| HEX | 150 |
| ROX | 134 |
| Cy5 | 153 |
Table 9: Results for the PCR for mastermix 2 experiment 1 (IMP, VIM, IC). Values in Cq. IC = internal control, a PCR control that is added by the manufacturer to the mastermix determines if a PCR reaction occurred. It can have high values if inhibition is present. Every well used for the PCR should have a value for the IC (including NTC). C+ = positive control with standard material provided by the manufacturer to see how a positive PCR reaction would look like. NTC = negative template control that is used as a contamination control for the used mastermix. C+ is only used as control for the step of the PCR, P+ is used as matrix control for the preparation steps in the process.
| Samples | Cq IC Trip. 1 | Cq IC Trip. 2 | Cq IC Trip. 3 | Cq IMP Trip. 1 | Cq IMP Trip. 2 | Cq IMP Trip. 3 | Cq VIM Trip. 1 | Cq VIM Trip. 2 | Cq VIM Trip. 3 |
| C+ | 38.6 | No Cq | 29.95 | 20.26 | 20.3 | 20.06 | 20.2 | 20.02 | 19.9 |
| NTC | 29.03 | 28.99 | 29.34 | No Cq | No Cq | No Cq | No Cq | No Cq | No Cq |
| 1 | 29.61 | 29.88 | 28.69 | 33.52 | 33.08 | 33.21 | 30.52 | 30.37 | 31.91 |
| 2 | 29.59 | 29.15 | 28.24 | 33.25 | 33.14 | 33.14 | 28.75 | 28.88 | 29.75 |
| 3 | 29.67 | 29.63 | 28.41 | 31.11 | 31.24 | 31.41 | 27.57 | 27.55 | 28.35 |
| 4 | 31.61 | 30.49 | 28.14 | 31.4 | 31.59 | 31.81 | 24.52 | 24.68 | 25.39 |
| 5 | 31 | 29.9 | 28.6 | 28.31 | 28.25 | 28.53 | 27.64 | 27.79 | 28.72 |
| 6 | 30.58 | 30.25 | 28.66 | 28.69 | 28.61 | 28.83 | 30.57 | 30.42 | 31.08 |
| 7 | 29.12 | 29.29 | 28.97 | 42.21 | 42.46 | 30.94 | 34.05 | 33.1 | 35.34 |
| 8 | 29.95 | 30.11 | 29.86 | 32.45 | 32.5 | 32.44 | 28.67 | 28.76 | 28.7 |
| 9 | 29.28 | 29.34 | 28.89 | 26.1 | 26.06 | 25.54 | 31.3 | 31.36 | 30.77 |
| 10 | 29.38 | 29.01 | 28.2 | 29.47 | 29.6 | 29.97 | 28.56 | 28.5 | 29.59 |
Table 10: Pipetting scheme of the second PCR using the Carbaplex kit: dilution series of the positive control, NTC and one blank (contains only nuclease-free water). Triplicates tested for all dilutions. A1 to H3 contained master mix 1, A7 to H9 master mix 2. F1 to F3, A4 to H6 and F7 to F9 did not contain any sample.
| 1 | 2 | 3 | 4 | 5 | 6 | 7 | 8 | 9 | 10 | 11 | 12 | |
| A | C+ | C+ | C+ | C+ | C+ | C+ | ||||||
| B | C+ 1:10 | C+ 1:10 | C+ 1:10 | C+ 1:10 | C+ 1:10 | C+ 1:10 | ||||||
| C | C+ 1:1000 | C+ 1:1000 | C+ 1:1000 | C+ 1:1000 | C+ 1:1000 | C+ 1:1000 | ||||||
| D | C+ 1:10000 | C+ 1:10000 | C+ 1:10000 | C+ 1:10000 | C+ 1:10000 | C+ 1:10000 | ||||||
| E | C+ 1:100000 | C+ 1:100000 | C+ 1:100000 | C+ 1:100000 | C+ 1:100000 | C+ 1:100000 | ||||||
| F | ||||||||||||
| G | NTC | NTC | NTC | NTC | NTC | NTC | ||||||
| H | Blank | Blank | Blank | Blank | Blank | Blank |
Table 2: Results of experiment 2 for master mix 1 using the Carbaplex kit from Bruker. IC = internal control, a PCR control that is added by the manufacturer to the mastermix and determines if a PCR reaction occurred. It can have high values if there is inhibition present. Every well used for the PCR should have a value for the IC (including NTC). C+ = positive control with standard material provided by the manufacturer to see how a positive PCR reaction would look like. NTC = negative template control that is used as a contamination control for the used mastermix. C+ is only used as control for the step of the PCR, P+ is used as matrix control for the preparation steps in the process.
| Samples | Cq IC Trip. 1 | Cq IC Trip. 2 | Cq IC Trip. 3 | Cq KPC Trip. 1 | Cq KPC Trip. 2 | Cq KPC Trip. 3 | Cq NDM Trip. 1 | Cq NDM Trip. 2 | Cq NDM Trip. 3 | Cq OXA-48 Trip. 1 | Cq OXA-48 Trip. 2 | Cq OXA-48 Trip. 3 |
| C+ | No Cq | No Cq | No Cq | 20.04 | 20.18 | 20.29 | 20.02 | 20.06 | 20.14 | 17.72 | 17.77 | 17.82 |
| C+ 1:10 | No Cq | No Cq | No Cq | 23.42 | 23.14 | 23.13 | 23.25 | 23.25 | 23.28 | 20.81 | 20.81 | 20.87 |
| C+ 1:1000 | 28.82 | 28.96 | 29.16 | 29.4 | 29.59 | 29.18 | 30.06 | 29.8 | 30.12 | 27.65 | 27.69 | 27.69 |
| C+ 1:10000 | 28.63 | 28.89 | 29.45 | 32.18 | 32.38 | 32.41 | 33.4 | 34.47 | 34.6 | 30.98 | 31.26 | 30,59 |
| C+ 1:100000 | 28.66 | 29.08 | 29.14 | 36.01 | 36.11 | 36.58 | 36.07 | 36.87 | 37.11 | No Cq | 33.75 | 34,22 |
| NTC | 28.62 | 28.92 | 29.04 | No Cq | No Cq | No Cq | No Cq | No Cq | No Cq | No Cq | No Cq | No Cq |
| Blank | 28.86 | 29.35 | 29.59 | No Cq | No Cq | No Cq | No Cq | No Cq | No Cq | No Cq | No Cq | No Cq |
In the undiluted control, there is already a difference of 4.86 Cq values between triplicates 1 and 2. At a 10-1 dilution, a deviation of 1.6 Cq values can be observed between triplicates 1 and 3. In contrast, the dilutions 10-3, 10-4, 10-5 show small differences. Furthermore, fluctuations in the Cq values for IMP genes in the HEX channel were observed between 1.27 and 2.03, in addi-tion to the “No Cq” value for the third triplicate of the 10-1 dilution. According to Rahbari et al., 2021, such deviations can be caused by pipetting errors that occur during the analytical phase. These can lead to less material being present in the wells, thus achieving a higher Cq value in certain wells. With regard to the standard straight line equations, it can be said that no precise statements can be made due to the unknown concentration of the positive control. To determine the quality parameters, it was assumed that a known copy number of genes was present, which was not the case. Therefore, it is important to note at this point that repeating the experiment using a standard is essential. The slope, efficiency, and R2 parameters were within the internally defined ranges. However, the y-intercept values for VIM-, IMP- and NDM-encoding genes exceeded the desired value of 39. However, since the assumed copy number of the dilution steps was purely theoretical, the y-intercept is not meaningful for the evaluation of this experi-ment. It should also be noted that results from the last dilution step 10-5 were omitted, because they contained “No Cq” outputs or had high deviations, indicating that the sensitivity of the test decreases with increasing dilution. In subsequent experiments with standard material of known concentration, the limits of detection and quantification should be approached with smaller dilu-tion steps. Furthermore, a higher n of values is required for a more precise determination of the individual dilution steps in order to make reliable and statistically correct statements. Since only a small number of samples (n) was available for these experiments, no standard deviations were calculated. However, apart from the differences, two experiments were successful and represent an opportunity for the introduction of a routine measurement of carbapenemase-encoding genes in wastewater. Considering that the kit was developed and tested only for the detection of car-bapenemase-encoding genes in nucleic acids extracted from rectal swabs and bacterial cultures (“Instructions for Use Carbaplex IVD Real-Time PCR Kit”, 2019), it still delivered satisfying results for wastewater.
Table 3: Results of the experiment 2 for master mix 2 using the Carbaplex kit from Bruker. Values generated by AriaDx programm, values in Cq for the dilution series. IC = internal control, a PCR control that is added by the manufacturer to the mastermix and determines, if a PCR reaction occurred. It can have high values if there is inhibition present. Every well used for the PCR should have a value for the IC (including NTC). C+ = positive control with standard material provided by the manufacturer to see how a positive PCR reaction would look like. NTC = negative template control that is used as a contamination control for the used mastermix. C+ is only used as control for the step of the PCR, P+ is used as matrix control for the preparation steps in the process.
| Samples | Cq IC Trip. 1 | Cq IC Trip. 2 | Cq IC Trip. 3 | Cq IMP Trip. 1 | Cq IMP Trip. 2 | Cq IMP Trip. 3 | Cq VIM Trip. 1 | Cq VIM Trip. 2 | Cq VIM Trip. 3 |
| C+ | 43.95 | 39.09 | No Cq | 20.61 | 20.56 | 20.56 | 20.56 | 20.43 | 20.42 |
| C+ 1:10 | 28.33 | 28.08 | 29.68 | 24.94 | 23.67 | No Cq | 23.55 | 23.63 | 23.64 |
| C+ 1:1000 | 28.79 | 28.95 | 29.03 | 30.01 | 29.87 | 29.88 | 30.93 | 30.6 | 30.21 |
| C+ 1:10000 | 29.33 | 29.5 | 28.9 | 33.3 | 32.27 | 31.73 | 34.04 | 33.12 | 33.61 |
| C+ 1:100000 | 28.88 | 29.13 | 29.03 | 41.62 | 39.59 | No Cq | No Cq | No Cq | No Cq |
| NTC | 29.73 | 28.89 | 29.19 | No Cq | No Cq | No Cq | No Cq | No Cq | No Cq |
| Blank | 29.47 | 29.4 | 29.4 | No Cq | No Cq | No Cq | No Cq | No Cq | No Cq |
In the undiluted control, there is already a difference of 4.86 Cq values between triplicates 1 and 2. At a 10-1 dilution, a deviation of 1.6 Cq values can be observed between triplicates 1 and 3. In contrast, the dilutions 10-3, 10-4, 10-5 show small differences. Furthermore, fluctuations in the Cq values for IMP genes in the HEX channel were observed between 1.27 and 2.03, in addition to the “No Cq” value for the third triplicate of the 10-1 dilution. According to Rahbari et al., 2021, such deviations can be caused by pipetting errors that occur during the analytical phase. These can lead to less material being present in the wells, thus achieving a higher Cq value in certain wells. With regard to the standard straight line equations, it can be said that no precise statements can be made due to the unknown concentration of the positive control. To determine the quality parameters, it was assumed that a known copy number of genes was present, which was not the case. Therefore, it is important to note at this point that repeating the experiment using a standard is essential. The slope, efficiency, and R2 parameters were within the internally defined ranges. However, the y-intercept values for VIM-, IMP- and NDM-encoding genes exceeded the desired value of 39. However, since the assumed copy number of the dilution steps was purely theoretical, the y-intercept is not meaningful for the evaluation of this experiment. It should also be noted that results from the last dilution step 10-5 were omitted, because they contained “No Cq” outputs or had high deviations, indicating that the sensitivity of the test decreases with increasing dilution. In subsequent experiments with standard material of known concentration, the limits of detection and quantification should be approached with smaller dilution steps. Furthermore, a higher n of values is required for a more precise determination of the individual dilution steps in order to make reliable and statistically correct statements. Since only a small number of samples (n) was available for these experiments, no standard deviations were calculated. However, apart from the differences, two experiments were successful and represent an opportunity for the introduction of a routine measurement of carbapenemase-encoding genes in wastewater. Considering that the kit was developed and tested only for the detection of carbapenemase-encoding genes in nucleic acids extracted from rectal swabs and bacterial cultures (“Instructions for Use Carbaplex IVD Real-Time PCR Kit”, 2019), it still delivered satisfying results for wastewater.
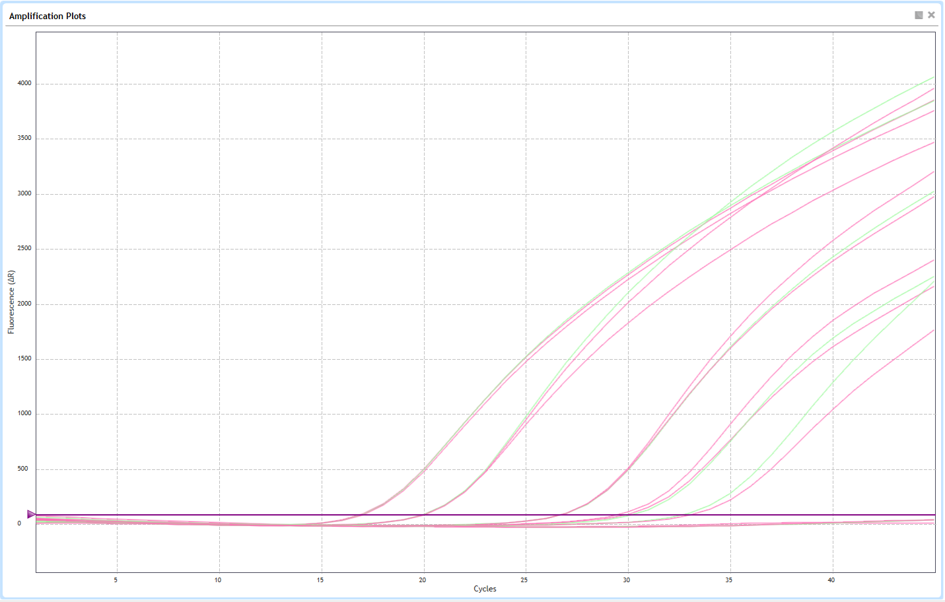
The manual explains the use of the kit in detail and clearly, so there were no difficulties during implementation. However, the preparation of the master mix is critical. Problems can arise with small sample volumes, as the required volume for PCR water is 0.25 µL. Therefore, the kit is only recommended for larger sample volumes. Pipetting errors must also be taken into account with such small volumes. For both experiments, as previously mentioned, three wells (approximately 10% of the total volume) were additionally included in the master mix calculations in addition to the required sample volumes. The results of the dilution series within the FAM channel areincluded as curves (Error! Reference source not found.). The result for the 10-1 dilution with Master Mix 1 has been omitted because “No Cq” was obtained for this dilution in all triplicates.
Despite the results reached by the Bruker kit by RT-qPCR, limitation of RT-qPCR-based wastewater surveillance is that the method detects target nucleic acids irrespective of bacterial viability. The measured carbapenemase gene concentrations may therefore reflect DNA originating from viable bacteria, non-viable cells, or extracellular DNA present in the wastewater matrix. In addition, the detection of a resistance gene does not necessarily indicate phenotypic resistance or active gene expression. Nevertheless, despite these limitations, RT-qPCR provides a rapid, sensitive, and cost-effective approach for population-level surveillance and trend analysis of clinically relevant antimicrobial resistance determinants in wastewater (Erler et al. 2024, Uluseker et al. 2021).
Conclusion
The experiments did show that qualitative detection of carbapenemase genes in wastewater with real-time PCR can be achieved successfully using the Bruker kit. However, further research is needed to precisely show that this kit also works for quantification of carbapenemase-encoding genes in wastewater in order to monitor rising and falling trends in the spread of ARG in a broader context. Beyond the specific findings of this study, the results highlight the broader value of routine wastewater surveillance as an integral component of antimicrobial resistance monitoring. By capturing resistance signals from entire communities, wastewater-based epidemiology can help bridge existing gaps in clinical surveillance, provide early detection of emerging resistance trends, and support risk assessment and public health decision-making. The integration of routine wastewater monitoring into national and international AMR surveillance frameworks may therefore contribute significantly to more effective prevention and control strategies.
Author Contributions: Jessica Kuru and Ole Huesing performed the experiments; Katharina Helmke and Jessica Kuru wrote the manuscript; David Drissner and Ole Huesing commented on the draft of the manuscript. All authors have read and agreed to the published version of the manuscript.
Data Availability Statement: All relevant data are within the manuscript.
Conflicts of Interests: All authors declare no conflicts of interest.
References
- Ahmed W, Simpson SL, Bertsch PM, Bibby K, Bivins A, Blackall LL, Shanks OC (2022). Minimizing errors in RT-PCR detection and quantification of SARS-CoV-2 RNA for wastewater surveillance. Science of the Total Environment. 805 (2022): 149877. DOI:10.1016/j.scitotenv.2021.149877
- Ambrosi C, Prezioso C, Checconi P, Scribano D, Sarshar M, Capannari M, Tomino C, Fini M, Garaci E, Palamara AT, et al.: SARS-CoV-2: Comparative analysis of different RNA extraction methods. J. Virol. Methods 2021, 287, 114008.
- Andersson DI, Hughes D (2017): Selection and Transmission of Antibiotic-Resistant Bacteria. Microbiol Spectr. 2017 Jul;5(4): 10.1128/microbiolspec.mtbp-0013-2016. doi: 10.1128/microbiolspec.MTBP-0013-2016.
- Bonetta S, Di Cesare A, Pignata C, Sabatino R, Macri M, Como G, Panizzolo M, Bonetta S, Carraro E. Occurrence of antibiotic-resistant bacteria and resistance genes in the urban water cycle. Environ Sci Pollut Res Int. 2023 Mar; 30(12): 35294-35306.
- Bonomo RA, Burd EM, Conly J, Limbago BM, Poirel L, Segre JA, Westblade LF. Carbapenemase-Producing Organisms: A Global Scourge. Clin Infect Dis. 2017 Oct 16; 66(8): 1290-1297.
- Brown CL, Rumi MA, McDaniel L, Maile-Miskowitz A, Sein J, Nguyen L, Choi M, Hindi F, Mullet J, Emon M, Moumi NA, Blair MF, Davis BC, Rao J, Baffoe-Bonni A, Vikesland P, Pruden A, Zhang L. Metagenomics disentangles epidemiological and microbial ecological associations between community antibiotic use and antibiotic resistance indicators measured in sewage. MedRxiv 2024. https://doi.org/10.1101/2024.12.11.24318846, 12.11.24318846.
- Buelow E, Bayjanov JR, Majoor E, Willems RJ, Bonten MJ, Schmitt H, van Schaik W. Limited influence of hospital wastewater on the microbiome and resistome of wastewater in a community sewerage system. FEMS Microbiol. Ecol. 94 (7), fiy087. https://doi.org/10.1093/femsec/fiy087.
- Choi CH, Kim E, Yang SM, Kim DS, Suh SM, Lee GY, Kim HY. Comparison of Real-Time PCR and Droplet Digital PCR for the Quantitative Detection of Lactiplantibacillus plantarum subsp. plantarum. Foods 2022, 11, 1331. https://doi.org/10.3390/foods11091331.
- Das S. The crisis of carbapenemase mediated carbapenem resistance across the human-animal-environmental interface in India. Infect Dis Now 2023 Feb; 53(1): 104628.
- Erler T, Droop F, Lübbert C, Knobloch JK, Carlsen L, Papan C, Savin M. Analysing carbapenemases in hospital wastewater: Insights from intracellular and extracellular DNA using qPCR and digital PCR. August 2024. Science of the Total Environment. https://doi.org/10.1016/j.scitotenv.2024.175344
- Fahrenfeld N, Bisceglia KJ. Emerging investigators series: sewer surveillance for monitoring antibiotic use and prevalence of antibiotic resistanc: urban sewer epidemiology. Environ. Sci. Water Res. Technol. 2(5), 788-799. https://doi.org/10.1039/C6EW00158K.
- Hendriksen, RS, Munk, P, Njage, P et al. Global monitoring of antimicrobial resistance based on metagenomics analyses of urban sewage. Nat Commun 10, 1124 (2019). https://doi.org/10.1038/s41467-019-08853-3.
- Instructions for Use Carbaplex IVD Real-Time PCR Kit,” 2019. Bruker, 37. file:///C:/Users/G9KJ/Desktop/Publikationen%20AMR/IFU_Carbaplex_IVD_PCR_Kit_en_D.pdf
- Ju F, Beck K, Yin X, Maccagnan A, McArdell CS, Singer HP, Johnson DR, Zhang T, Bürgmann H. Wastewater treatment plant resistomes are shaped by bacterial composition, genetic exchange, and upregulated expression in the effluent microbiomes, The ISME Journal, Volume 13, Issue 2, February 2019, Pages 346–360
- Keely SP, Brinkman NE, Wheaton EA, Jahne MA, Siefring SD, Varma M, Hill RA, Leibowitz SG, Martin RW, Garland JL, Haugland RA: Geospatial patterns of antimicrobial resistance genes in the US EPA national rivers and streams assessment survey. Environ. Sci. Technol. 56(21), 14960-14971. https://DOI.org/10.1021/acs.est.2c00813.
- Klümper U, Recker M, Zhang L, Yin X, Zhang T, Buckling A, Gaze WH. Selection for antimicrobial resistance is reduced when empedded in a natural community. ISME J. 13 (12), 2927-2937. https://doi.org/10.1038/s41396-019-0483-z.
- Mariappan S, Sekar U, Kamalanathan A. Carbapenemase-producing Enterobacteriaceae. International Journal of Applied and Basic Medical Research 7(1):p 32-39, Jan-Mar 2017. DOI:10.4103/2229-516X.198520
- Marquar N, Pütz P, Buchholz U, Exner T, Fretschner T, Greiner T, Helmrich M, Lukas M, Marty M, Obermaier N, Saravia Arzabe C, Schattschneider A, Schneider B, Selinka H-C, Ullrich A, Walter B, Braun U, Schumacher J (2024). SARS-CoV-2-Abwassersurveillance in Deutschland im Rahmen des Projekts AMELAG. Epidemiologisches Bulletin 34: 16-26. DOI 10.25646/12208
- Müller H, Sib E, Gajdiss M, Klanke U, Lenz-Plet F, Barabasch V, Albert C, Schallenberg A, Timm C, Zacharias N, et al. (2018). Dissemination of multi-resistant Gram-negative bacteria into German wastewater and surface waters. FEMS Microbiology Ecology, 94(5), fiy057. https://doi.org/10.1093/femsec/fiy057
- Munita JM, Arias CA, 2016: Mechanisms of Antibiotic Resistance. Microbiol Spectr. 2016 April; 4(2): doi:https://doi.org/10.1128/microbiolspec.vmbf-0016-2015.
- Munk P, Brinch C, Moller FD, Petersen TN, Hendriksen RS, Seyfarth AM, Kjelgaard JS, Svendsen CA, van Bunnik B, Berglund F, Global Sewage Surveillance Consortium, Larsson DGJ, Koopmans M, Woolhouse M, Aarestrup FM. Genomic analysis of sewage from 101 countries reveals global landscape of antimicrobial resistance. Nat. Commun., 13 (1) (2022), pp. 7251-7257, 10.1038/s41467-022-34312-7.
- Murray CJL et al., 2022: Global burden of bacterial antimicrobial resistance in 2019: a systematic analysis. The Lancet, Volume 399, Issue 10325, 629-655. DOI: 10.1016/S0140-6736(21)02724-0.
- Nordmann P, Naas T, Poirel L. Global spread of Carbapenemase-producing Enterobacteriaceae. Emerg Infect Dis 2011 Oct; 17(10): 1791-8. https://doi.org/10.3201/eid1710.110655.
- Poirel L, Rodriguez-Martinez JM, Mammeri H, Liard A, Nordmann P. 2005. Origin of plasmid-mediated quinolone resistance determinant QnrA. Antimicrob Agents Chemother 49: 3523-3525. DOI: 10.1128/AAC.49.8.3523-3525.2005.
- Proia L, Anzil A, Borrego C, Farré M, Llorca M, Sanchis J, Bogaerts P, Balcázar JL, Servais P, 2018. Occurrence and persistence of carbapenemases genes in hospital and wastewater treatment plants and propagation in the receiving river. J. Hazard. Mater. 358, 33-43. https://doi.org/10.1016/j.jhazmat.2018.06.058.
- Queenan AM, Bush K, 2007. Carbapenemases: Versatile β-Lactamases. Clinical Microbiology Reviews. Juli 2007. 440-458. doi:https://doi.org/10.1128/cmr.00001-07.
- Rahbari R, Moradi N, Abdi M. (2021). rRT-PCR for SARS-CoV-2: Analytical considerations. Clinica Chimica Acta. 2021 May: 516:1-7. doi: 10.1016/j.cca.2021.01.011.
- Ramirez MS, Bonomo RA, Tomalsky ME. Carbapenemases: Transforming
- Acinetobacter baumanii into a Yet More Dangerous Menace. Biomolecules.
- doi:10.3390/biom10050720.
- Ramos, B., Lourenço, A. B., Monteiro, S., Santos, R., & Cunha, M. V. (10. Oktober 2024). Metagenomic profiling of raw wastewater in Portugal highlights microbiota and resistome signatures of public health interest beyond the usual suspects. Science of The Total Environment. doi:https://doi.org/10.1016/j.scitotenv.2024.174272.
- Rodriguez-Mozaz S, Chamorro S, Marti E, Huerta B, Gros M, Sànchez-Melsió A, Borrego CM, Barceló D, Balcázar JL, 2015. Occurrence of antibiotics and antibiotic resistance genes in hospital and urban wastewaters and their impact on the receiving river. Water Res. 69, 234-242. https://doi.org/10.1015/j.watres.2014.11.021.
- Sidstedt M, Rådström, P., & Hedmann, J. (12. Februar 2020). PCR inhibition in qPCR, dPCR and MPS-mechanisms and solutions. Analytical and Bioanalytical Chemistry. doi:10.1007/s00216-020-02490-2.
- Szekeres E, Baricz A, Chiriac CM, Farkas A, Opris O, Soran ML, Andrei AS, Rudi K, Balcázar JL, Dragos N, Coman C, 2017. Abundance of antibiotics, antibiotic resistance genes and bacterial community composition in wastewater effluents from different romanian hospitals. Environ. Pollut. 225, 304-315. https://doi.org/10.2016/j.envpol.2017.01.054.
- Uluseker C, Kaster KM, Thorsen K, Basiry D, Shobana S, Jain M, Kumar G, Kommedal R, Pala-Ozkok I, 2021: A review on occurrence and spread of antibiotic resistance in wastewaters and in wastewater treatment plants: mechanisms and perspectives. Front. Microbiol. 12, 717809. https://doi.org/10.3389/fmicb.2021.717809.
- Taylor SC, Laperriere G, Germain H. Droplet Digital PCR versus qPCR for gene expression analysis with low abundant targets: from variable nonsense to publication quality data. Scientific Reports, 7: 2409. DOI:10.1038/s41598-017-02217-x
- Van Duin D, Arias CA, Komarow L, Chen LC, Hanson BM, Weston, G. Molecular and clinical epidemiology of carbapenem-resistant Enterobacterales in the USA (CRACKLE-2): a prospective cohort study. Lancet Infect. Dis. 20, 731-741 (2020).
- Zurfluh K, Bagutti C, Brodmann P, Alt M, Schulze J, Fanning S, Stephan R, Nüesch-Inderbinen M. (2017). Wastewater is a reservoir for clinically relevant carbapenemase- and 16S rRNA methylase-producing Enterobacteriaceae. International Journal of Antimicrobial Agents, 50(3), 436-440. https://doi.org/10.1016/j.ijantimicag.2017.04.017
Please refer below for Supporting Information:
| Table 1: Master mix 1 and 2 for 39 wells. Reagents Volume [µL] PCR Master Mix – Carbaplex 487.5 Carbaplex Master Mix 1 or 2 48.75 PCR water 9.75 Internal Control 39 Total volume Master Mix 585 | Table 2: Master mix 1 and 2 for 24 wells. Reagents Volume [µL] PCR Master Mix – Carbaplex 300 Carbaplex Master Mix 1 or 2 30 PCR water 6 Internal Control 24 Total volume Master Mix 360 |
Table 3: Pipetting scheme of the first PCR using the Carbaplex kit (C+: positive control, NTC: negative control). All samples have been measured in triplicates. A1 to H6 each 15 µl master mix 1. A7 to H12 master mix 2. X: empty wells.
| 1 | 2 | 3 | 4 | 5 | 6 | 7 | 8 | 9 | 10 | 11 | 12 | |
| A | C+ | C+ | C+ | 1 | 1 | 1 | C+ | C+ | C+ | 1 | 1 | 1 |
| B | x | x | x | 2 | 2 | 2 | x | x | x | 2 | 2 | 2 |
| C | NTC | NTC | NTC | 3 | 3 | 3 | NTC | NTC | NTC | 3 | 3 | 3 |
| D | x | x | x | 4 | 4 | 4 | x | x | x | 4 | 4 | 4 |
| E | 9 | 9 | 9 | 5 | 5 | 5 | 9 | 9 | 9 | 5 | 5 | 5 |
| F | 10 | 10 | 10 | 6 | 6 | 6 | 10 | 10 | 10 | 6 | 6 | 6 |
| G | x | x | x | 7 | 7 | 7 | x | x | x | 7 | 7 | 7 |
| H | x | x | x | 8 | 8 | 8 | x | x | x | 8 | 8 | 8 |
Table 7: Thresholds for experiment 1, set manually (values AriaDX program).
| Color channel | Threshold |
| FAM | 36 |
| HEX | 120 |
| ROX | 135 |
| Cy5 | 120 |
Table 8: Thresholds for experiment 2 with dilution series of the positive control (values AriaDX program).
| Color channel | Threshold |
| FAM | 33 |
| HEX | 150 |
| ROX | 134 |
| Cy5 | 153 |
Table 9: Results for the PCR for mastermix 2 experiment 1 (IMP, VIM, IC). Values in Cq. IC = internal control, a PCR control that is added by the manufacturer to the mastermix determines if a PCR reaction occurred. It can have high values if inhibition is present. Every well used for the PCR should have a value for the IC (including NTC). C+ = positive control with standard material provided by the manufacturer to see how a positive PCR reaction would look like. NTC = negative template control that is used as a contamination control for the used mastermix. C+ is only used as control for the step of the PCR, P+ is used as matrix control for the preparation steps in the process.
| Samples | Cq IC Trip. 1 | Cq IC Trip. 2 | Cq IC Trip. 3 | Cq IMP Trip. 1 | Cq IMP Trip. 2 | Cq IMP Trip. 3 | Cq VIM Trip. 1 | Cq VIM Trip. 2 | Cq VIM Trip. 3 |
| C+ | 38.6 | No Cq | 29.95 | 20.26 | 20.3 | 20.06 | 20.2 | 20.02 | 19.9 |
| NTC | 29.03 | 28.99 | 29.34 | No Cq | No Cq | No Cq | No Cq | No Cq | No Cq |
| 1 | 29.61 | 29.88 | 28.69 | 33.52 | 33.08 | 33.21 | 30.52 | 30.37 | 31.91 |
| 2 | 29.59 | 29.15 | 28.24 | 33.25 | 33.14 | 33.14 | 28.75 | 28.88 | 29.75 |
| 3 | 29.67 | 29.63 | 28.41 | 31.11 | 31.24 | 31.41 | 27.57 | 27.55 | 28.35 |
| 4 | 31.61 | 30.49 | 28.14 | 31.4 | 31.59 | 31.81 | 24.52 | 24.68 | 25.39 |
| 5 | 31 | 29.9 | 28.6 | 28.31 | 28.25 | 28.53 | 27.64 | 27.79 | 28.72 |
| 6 | 30.58 | 30.25 | 28.66 | 28.69 | 28.61 | 28.83 | 30.57 | 30.42 | 31.08 |
| 7 | 29.12 | 29.29 | 28.97 | 42.21 | 42.46 | 30.94 | 34.05 | 33.1 | 35.34 |
| 8 | 29.95 | 30.11 | 29.86 | 32.45 | 32.5 | 32.44 | 28.67 | 28.76 | 28.7 |
| 9 | 29.28 | 29.34 | 28.89 | 26.1 | 26.06 | 25.54 | 31.3 | 31.36 | 30.77 |
| 10 | 29.38 | 29.01 | 28.2 | 29.47 | 29.6 | 29.97 | 28.56 | 28.5 | 29.59 |
Table 10: Pipetting scheme of the second PCR using the Carbaplex kit: dilution series of the positive control, NTC and one blank (contains only nuclease-free water). Triplicates tested for all dilutions. A1 to H3 contained master mix 1, A7 to H9 master mix 2. F1 to F3, A4 to H6 and F7 to F9 did not contain any sample.
| 1 | 2 | 3 | 4 | 5 | 6 | 7 | 8 | 9 | 10 | 11 | 12 | |
| A | C+ | C+ | C+ | C+ | C+ | C+ | ||||||
| B | C+ 1:10 | C+ 1:10 | C+ 1:10 | C+ 1:10 | C+ 1:10 | C+ 1:10 | ||||||
| C | C+ 1:1000 | C+ 1:1000 | C+ 1:1000 | C+ 1:1000 | C+ 1:1000 | C+ 1:1000 | ||||||
| D | C+ 1:10000 | C+ 1:10000 | C+ 1:10000 | C+ 1:10000 | C+ 1:10000 | C+ 1:10000 | ||||||
| E | C+ 1:100000 | C+ 1:100000 | C+ 1:100000 | C+ 1:100000 | C+ 1:100000 | C+ 1:100000 | ||||||
| F | ||||||||||||
| G | NTC | NTC | NTC | NTC | NTC | NTC | ||||||
| H | Blank | Blank | Blank | Blank | Blank | Blank |