Biochemical Characterization of Different Species of Microalgae with Potential Application in Agricultural Biostimulants
V. Navarro-Pérez1; U. Navarro-Zapata1, R. Perez-Millan2, S. Simón-Grao1 and F. García-Sánchez1*
DOI: 10.37722/JAMBE.2025205
Abstract
The increasing use of biostimulants in agriculture aims to enhance crop productivity and tolerance to stress. In this framework, microalgae, diatoms, and cyanobacteria emerge as valuable sources of bioactive compounds for developing sustainable agricultural inputs. This study presents the biochemical characterization of four microalgae (Chlorella vulgaris, Haematococcus pluvialis, Isochrysis sp., and Nannochloropsis gaditana), two diatoms (Phaeodactylum tricornutum and Skeletonema sp.), and one cyanobacterium (Arthrospira platensis). Their dry biomass was analyzed for total phenols, proteins, vitamins, reducing sugars, antioxidant activity, mineral nutrients, hormones, amino acids, organic acids, sugars, osmolytes, monosaccharides, polysaccharides, and uronic acids. The results showed notable biochemical diversity among species. Diatoms, particularly P. tricornutum and Skeletonema sp., exhibited a broad range of bioactive compounds, while Isochrysis sp. and P. tricornutum had the highest metabolite concentrations. H. pluvialis was rich in auxins and gibberellins, N. gaditana in proline and betaine, A. platensis in acetate, and C. vulgaris in sucrose and xylose. All species presented significant carbohydrate content. These findings underline the biochemical richness of these organisms and reinforce their potential as biostimulant ingredients, contributing to sustainable and efficient agricultural practices.
Watch the Article in Motion
Keywords: algal biomass; bioactive compounds; omics sciences; primary metabolites; photosynthetic microorganisms
Introduction
Microalgae are unicellular organisms that inhabit a wide range of aquatic environments, including seas, lakes, and freshwater areas, although some species are also capable of colonizing terrestrial habitats. These are photosynthetic organisms with a high growth capacity that play a key role in carbon fixation and the nitrogen cycle. Their classification is based on characteristics such as pigmentation and cellular structure [1]. Within this group, species such as Chlorella vulgaris stand out, a freshwater green microalga widely studied for its resistance to adverse environmental conditions and its high content of proteins, lipids, and bioactive pigments [2]; and Haematococcus pluvialis, known for its ability to accumulate large amounts of astaxanthin, a carotenoid with a potent antioxidant activity, especially under stress conditions [3].
Diatoms are unicellular eukaryotic algae that are widely distributed in both marine and freshwater aquatic ecosystems, where they are considered an essential component of phytoplankton and benthic communities. They are characterized by a silica-rich cell wall, with shapes and patterns that vary among species, and have attracted increasing interest due to their potential biotechnological applications. In addition, they play a key role in the biogeochemical cycles of carbon and silicon [4]. Among the most extensively studied species, we find Phaeodactylum tricornutum, considered a model species due to its ease of cultivation, tolerance to variable conditions, and ability to produce lipids, carotenoids, and other bioactive compounds [5]. Skeletonema sp., in turn, represents a common coastal genus whose biomass contains high contents of lipids, proteins, and antioxidant compounds [6].
Cyanobacteria are photosynthetic prokaryotic organisms that inhabit a wide variety of aquatic and terrestrial environments. They are characterized by the presence of chlorophyll a and accessory pigments such as phycocyanin and phycoerythrin, which give them bluish or reddish hues. Many species possess the ability to fix atmospheric nitrogen, providing them with an ecological advantage in environments with low nitrogen availability. In addition, they participate in the carbon cycle and exhibit a high resistance to extreme conditions, such as desiccation, UV radiation, and high temperatures [7]. Notable species include Arthrospira platensis, a filamentous cyanobacterium known for its high protein content and as a source of phycobiliproteins such as phycocyanin, which are associated with antioxidant effects and hold a broad application potential across various sectors [8]; and Nostoc sp., a species used in soil rehabilitation and as a natural fertilizer in rice cultivation due to its ability to fix atmospheric nitrogen, is also of interest for its potential to produce bioplastics [9].
In the current context of sustainable agriculture and climate change, biostimulants represent a promising alternative to enhance agricultural productivity and to reduce the use of conventional fertilizers. They are substances or microorganisms that when applied to plants or soil, regulate physiological processes, promote plant development, mitigate stress effects, and contribute to increasing crop yield [10,11]. A variety of active ingredients can be used in their formulation, including microalgae, diatoms, and cyanobacteria. These species have been widely studied due to their rich composition in bioactive compounds such as proteins, lipids, mineral nutrients, carbohydrates, vitamins, and phytohormones [12]. Among the most commonly used in the development of biostimulant products, we find microalgae such as Chlorella vulgaris, Haematococcus pluvialis, Isochrysis sp., and Nannochloropsis gaditana; diatoms such as Phaeodactylum tricornutum and Skeletonema sp.; and the cyanobacterium Arthrospira platensis. These species have shown positive effects on various crops, such as tomato and pepper, contributing to enhanced plant growth and improved tolerance to abiotic stress [13,14]. However, although some studies have explored the biochemical composition of individual species, comparative analyses that include a broad range of microalgae using commercially sourced biomass and evaluating multiple biochemical parameters are still limited.
This study aims to characterize the biomass of seven algal species with potential applications in agriculture, focusing on their biochemical composition, metabolite profile, and nutritional content. This characterization provides a solid foundation for selecting suitable microalgae, diatoms, and cyanobacteria for biostimulant formulation, taking into account both the species and the bioactive compounds, as well as their mode of action.
Materials and Methods
Microalgae, diatoms and cyanobacteria studied
In this study, seven species of photosynthetic microorganisms were analyzed, classified as follows: microalgae, including Chlorella vulgaris, Haematococcus pluvialis, Isochrysis sp., and Nannochloropsis gaditana; diatoms, represented by Phaeodactylum tricornutum and Skeletonema sp.; and one cyanobacterium, Arthrospira platensis.
The biomass of these microorganisms was provided by companies specialized in their cultivation, harvesting, and processing. Neoalgae (Gijón, Asturias, Spain) supplied the microalgae H. pluvialis and N. gaditana, as well as the diatom P. tricornutum. Phytobloom (Algarve, Portugal) provided the microalga Isochrysis sp. and the diatom Skeletonema sp. Additionally, Bioréa (Lamballe-Armor, France) and Cianoalgae (Madrid, Spain) supplied the microalga C. vulgaris and the cyanobacterium A. platensis, respectively. The biomass, delivered in a dry state, was obtained according to the procedures established by each supplying company. Specific details regarding strain identity, culture medium, light intensity, pH, or other cultivation conditions were not disclosed by the suppliers. Although specific cultivation details were not disclosed by the suppliers, all biomass samples were produced under standard phototrophic conditions typically used for large-scale microalgal cultivation, including exposure to continuous light–dark cycles (12–16 h of light), temperatures between 20–25 °C, and aeration with filtered air enriched with CO₂. These conditions are commonly applied to maintain optimal growth and biochemical composition in commercial algal production systems. However, it should be noted that environmental factors such as light intensity, nutrient availability, and salinity can affect the biochemical profile of microalgae. No additional processing or cell disruption was carried out prior to the biochemical analyses, in order to characterize the composition of the final commercial product. All analyses were carried out at the CEBAS-CSIC.
The selection of these species was primarily based on their commercial availability, as they are the most widely produced and marketed by European companies dedicated to the cultivation and sale of microalgal biomass. This ensured access to standardized and traceable materials suitable for comparative biochemical analysis. In addition, these species are among the most representative and well-studied in terms of their potential biostimulant properties. Chlorella vulgaris and Haematococcus pluvialis are freshwater green microalgae widely used for their high content of proteins, pigments, and antioxidants. Isochrysis sp. and Nannochloropsis gaditana are marine microalgae rich in lipids and carotenoids, with proven biotechnological applications. The diatoms Phaeodactylum tricornutum and Skeletonema sp. are considered model species due to their diverse metabolite profiles and ease of cultivation. Finally, the cyanobacterium Arthrospira platensis (commonly known as Spirulina) was included because of its long history of use in agriculture and its high protein and phycobiliprotein content, which are associated with growth-promoting activity in crops.
Biochemical characterization of the biomass
Biochemical profile
The quantification of total phenols in the microalgae, diatom, and cyanobacteria samples was carried out following the method described by Singleton et al. [15]. This procedure is based on the interaction of phenolic compounds with the Folin–Ciocalteu reagent, resulting in a colorimetric complex whose absorbance can be measured by spectrophotometry. For the determination of protein content, the protocol described by Bradford [16] was used, which is based on the affinity of the Coomassie Brilliant Blue G-250 dye for proteins. The intensity of the resulting color was compared to a calibration curve prepared with Bovine Serum Albumin (BSA), allowing for the quantification of protein in each sample. The concentration of vitamin A was determined according to the method described by Rutkowski and Grzegorczyk [17]. This protocol evaluates the difference between the solubilization of vitamin A in xylene, and its subsequent degradation after exposure to UV light. The vitamin C content was analyzed according to the procedure described by Gillespie and Ainsworth [18], adapted for plant-based samples. The extraction and quantification of reducing sugars were carried out according to the protocols established by Nelson [19] and Somogyi [20], which were based on a colorimetric reaction measured spectrophotometrically. The data were expressed in mg g-1 of dry weight (dw). The antioxidant activity of the biomass was determined using the DPPH (2,2-diphenyl-1-picrylhydrazyl) method, following the procedure described by Brand-Williams et al. [21], with slight modifications. For this, a methanolic extract was prepared using 10–20 mg dw of sample. Subsequently, 5 µL of the extract were added to 200 µL of a DPPH solution in methanol, and the absorbance was measured at 515 nm for 5 minutes using a spectrophotometer (BIOTEK Powerwave XS2, Marshall Scientific, Hampton, USA). The results were expressed as the percentage of DPPH radical inhibition.
Mineral analysis
A nutritional analysis of the samples was carried out to determine the concentration of macronutrients (sodium (Na), chlorine (Cl), magnesium (Mg), potassium (K), calcium (Ca), and phosphorus (P)), and micronutrients (manganese (Mn), iron (Fe), boron (B), zinc (Zn), and copper (Cu)). The quantification of these elements was performed using inductively coupled plasma atomic emission spectroscopy (ICP‐OES, Iris Intrepid II, Thermo Electron Corporation, Waltham, USA), after the digestion of 100 mg dw of sample with HNO3:H2O2 (5:3 v/v) in a microwave system (CERM Mars Xpress, North Carolina, USA). The data were expressed in mg g-1 dw for the macronutrients and in mg kg-1 dw for the micronutrients.
Hormonal profile
The phytohormones analyzed included the ethylene precursor 1-aminocyclopropane-1-carboxylic acid (ACC), melatonin (Mel), the cytokinins trans-zeatin (tZ) and isopentenyladenine (iP), the auxin indole-3-acetic acid (IAA), salicylic acid (SA), gibberellins (GA1, GA3, GA4), abscisic acid (ABA), and jasmonic acid (JA). The extraction was performed using 50 mg dw of sample, following the protocol described by Albacete et al. [22] and Martínez-Andújar et al. [23]. The analysis was carried out using U-HPLC-MS, employing a Vanquish U-HPLC system coupled to an Exactive mass spectrometer (ThermoFisher Scientific, Waltham, USA). Mass spectra were acquired in negative ion mode using Xcalibur software version 4.3 (ThermoFisher Scientific, Waltham, USA). For the quantification of each hormone, calibration curves were constructed using concentrations of 1, 10, 50, and 100 μg L-1, with corrections applied using deuterated internal standards at 10 μg L-1 ([2H4]ACC, [2H5]tZ, [2H6]iP, [2H5]IAA, [2H4]SA, [2H2]GA1, [2H2]GA3, [2H2]GA4, [2H6]ABA, [2H6]JA), provided by Olchemim Ltd (Olomouc, Czech Republic). Recovery rates ranged from 92% to 95%, and the results were expressed in ng g-1 dw.
Metabolic profile
The identification and quantification of primary metabolites in the microalgae, diatom, and cyanobacteria samples were carried out through a metabolomic analysis, following the protocol described by van der Sar et al. [24], and further detailed by Alfosea-Simón et al. [25]. The extraction was performed using a methanol–water solution (1:1), followed by homogenization, sonication, and centrifugation. The supernatant was evaporated to dryness using a SpeedVac system (ThermoFisher Scientific, Waltham, USA), and subsequently resuspended in a potassium phosphate buffer with EDTA. For the analysis, a Bruker 500 MHz spectrometer (Bruker Biospin, Rheinstetten, Germany) equipped with a 5 mm broadband CryoProbe Prodigy cooled with N2 was used. The spectra were processed using Chenomx NMR Suite version 9 (Chenomx Inc., Edmonton, Canada). The detected and quantified metabolites included the amino acids γ-Aminobutyric acid (GABA), Alanine (Ala), Asparagine (Asn), Aspartic acid (Asp), Glutamic acid (Glu), Glutamine (Gln), Isoleucine (Ile), Leucine (Leu), Phenylalanine (Phe), Valine (Val), Proline (Pro), and Tyrosine (Tyr); the organic acids Acetate (Ace), Citrate (Cit), Formate (For), Lactate (Lac), and Succinate (Suc); the sugars Fructose (Fru), Glucose (Glc), Mannitol (Man), and Sucrose (Sac); and other metabolites such as Betaine (Bet) and Trigonelline (Tri). The data were expressed in mg g-1 dw.
Carbohydrate profile
The characterization of monosaccharides and uronic acids in the algal biomass was carried out following the protocol described by Templeton et al. [26]. For this, 100 mg dw of sample were subjected to a two-step acid hydrolysis: 1) incubation in a water bath at 30 ᵒC for 1 hour with 72% (w/w) H2SO4, and 2) dilution to a final concentration of 4% (w/w) H2SO4, followed by autoclaving at 121 ᵒC for 1 hour to complete the hydrolysis. The released carbohydrates were analyzed by high-resolution ion-exchange chromatography with pulsed amperometric detection (HPAEC-PAD), using a Dionex ICS-3000 system (ThermoFisher Scientific, Waltham, USA) equipped with a Dionex CarboPac PA1 column. The separation was optimized using 20 mM NaOH as the mobile phase and a column temperature of 37.5 ᵒC. The monosaccharides arabinose, fucose, rhamnose, and xylose, as well as the uronic acids galacturonic, glucuronic, and iduronic, were detected. The data were expressed in units of g 100g-1 dw.
In addition, the extraction and purification of fucoidans were carried out according to the method described by Zayed et al. [27], based on affinity chromatography with dyes using beads functionalized with toluidine blue, followed by elution with 3M NaCl in 30% ethanol and lyophilization. In the case of laminarin, its quantification was carried out following the protocol described by Albalasmeh et al. [28]. For this, 1 mL of extract was mixed with 3 mL of concentrated sulfuric acid, shaken for 30 seconds, and cooled in an ice bath for 2 minutes. The absorbance was measured at 315 nm using a spectrophotometer (BIOTEK Powerwave XS2, Marshall Scientific, Hampton, USA). On the other hand, the detection of alginic acid was performed according to the protocol described by Volpi [29], which includes enzymatic digestion with alginate lyase, followed by analysis using micellar electrokinetic chromatography (MEKC) with UV detection at 230 nm. The data were expressed in units of g 100g-1 dw.
Statistical analysis
Three subsamples of each microalga, diatom, and cyanobacterium provided by the distributing companies were analyzed using the techniques described previously. The results were expressed as the mean of three repetitions (n=3) ± the standard error (SE).
Abreviations
The abbreviations used for metabolites and hormones in this study include: ACC (1-aminocyclopropane-1-carboxylic acid), Mel (melatonin), tZ (trans-zeatin), iP (isopentenyladenine), IAA (indole-3-acetic acid), SA (salicylic acid), GA1, GA3, and GA4 (gibberellins A1, A3, and A4, respectively), ABA (abscisic acid), and JA (jasmonic acid) as phytohormones. The amino acids and related metabolites analyzed were GABA (γ-aminobutyric acid), Ala (alanine), Asn (asparagine), Asp (aspartic acid), Glu (glutamic acid), Gln (glutamine), Ile (isoleucine), Leu (leucine), Phe (phenylalanine), Val (valine), Pro (proline), and Tyr (tyrosine). The organic acids quantified included Ace (acetate), Cit (citrate), For (formate), Lac (lactate), and Suc (succinate). The sugars and osmolytes identified were Fru (fructose), Glc (glucose), Man (mannitol), Sac (sucrose), Bet (betaine), and Tri (trigonelline).
Results
The analysis of the different species of microalgae, diatoms, and cyanobacteria showed differences in the concentration of bioactive compounds, as presented in Table 1. The total phenol content ranged from 1.11 mg g-1 dw to 6.90 mg g-1 dw, while protein concentration fluctuated between 13.6 mg g-1 dw and 22.8 mg g-1 dw. Regarding vitamins, vitamin A values ranged from 9.69 mg g-1 dw to 45.9 mg g-1 dw, and vitamin C content ranged from 5.18 mg g-1 dw to 29.4 mg g-1 dw. The reducing sugars obtained concentrations between 3.32 mg g-1 dw and 18.2 mg g-1 dw. Similarly, antioxidant activity, expressed as percentage inhibition, ranged from 7 to 14, according to the data in Table 1. Among the analyzed species, Skeletonema sp. showed the highest values of total phenols, proteins, and reducing sugars, while Isochrysis sp. exhibited the highest concentrations of vitamins A and C. C. vulgaris, Isochrysis sp., P. tricornutum, and A. platensis, on the other hand, stood out for their high antioxidant activity.
Table 1. Concentration of total phenols, proteins, vitamin A, vitamin C, and reducing sugars (mg g-1 dw) and non-enzymatic antioxidant activity (% inhibition) in the different species studied.
| Algae | Total phenols (mg g-1 dw) | Proteins (mg g-1 dw) | Vitamin A (mg g-1 dw) | Vitamin C (mg g-1 dw) | Reducing sugars (mg g-1 dw) | Antioxidant activity (% Inhibition) |
| Microalgae | ||||||
| C. vulgaris | 1.11 ± 0.12 | 13.6 ± 1.36 | nd | 10.0 ± 0.57 | 4.09 ± 0.23 | 14 ± 0.80 |
| H. pluvialis | 1.46 ± 0.14 | 14.0 ± 2.13 | nd | 9.90 ± 0.57 | 11.7 ± 1.35 | 7 ± 0.38 |
| Isochrysis sp. | 6.67 ± 0.66 | 20.5 ± 1.18 | 45.9 ± 5.30 | 29.4 ± 3.39 | 5.79 ± 0.66 | 14 ± 2.08 |
| N. gaditana | 2.01 ± 0.30 | 21.6 ± 1.24 | 14.0 ± 1.40 | 5.18 ± 0.51 | 3.32 ± 0.38 | 13 ± 1.34 |
| Diatoms | ||||||
| P. tricornutum | 3.95 ± 0.39 | 22.4 ± 2.24 | 12.5 ± 1.25 | 7.54 ± 0.43 | 9.02 ± 0.52 | 14 ± 0.78 |
| Skeletonema sp. | 6.90 ± 0.69 | 22.8 ± 2.28 | 10.3 ± 0.59 | 15.7 ± 1.57 | 18.2 ± 1.82 | 13 ± 1.53 |
| Cyanobacteria | ||||||
| A. platensis | 1.31 ± 0.20 | 14.6 ± 1.46 | 9.69 ± 1.48 | 9.36 ± 0.93 | 4.19 ± 0.41 | 14 ± 0.80 |
**Data represent the mean value of three samples (n=3) ± SE. “nd” indicates that the element was not detected.
Mineral analysis
Table 2 shows the levels of macronutrients and micronutrients in the different species studied. Na values ranged from 2.02 mg g-1 dw to 45.1 mg g-1 dw, while Cl values ranged from 1.98 mg g-1 dw to 76.4 mg g-1 dw. Mg showed concentrations between 1.65 mg g-1 dw and 9.54 mg g-1 dw, and K showed values from 4.28 mg g-1 dw to 22.3 mg g-1 dw. In the case of Ca, the levels ranged from 1.08 mg g-1 dw to 37.2 mg g-1 dw, and P values ranged from 9.05 mg g-1 dw to 16.5 mg g-1 dw. Regarding micronutrients, Mn ranged from 54.9 mg kg-1 dw to 888.8 mg kg-1 dw, and Fe was found in a range from 491.7 mg kg-1 dw to 7,725.4 mg kg-1 dw. B levels ranged from 2.56 mg kg-1 dw to 38.0 mg kg-1 dw, Zn ranged from 27.3 mg kg-1 dw to 918.2 mg kg-1 dw, and Cu showed values from 7.68 mg kg-1 dw to 290.0 mg kg-1 dw.
Among the macronutrients, the highest concentrations of Na, Cl, Mg, and P were recorded in N. gaditana, while P. tricornutum showed the highest values of K and Ca. In the case of the micronutrients, H. pluvialis exhibited high levels of Mn, Zn, and Cu, and Isochrysis sp. and P. tricornutum stood out for their higher concentrations of Fe and B, respectively. Thus, N. gaditana was characterized by its high content of macronutrients, while H. pluvialis was predominant in high levels of specific essential trace elements.
Table 2. Concentration of macronutrients (mg g-1 dw) and micronutrients (mg kg-1 dw) in the different species analyzed.
| Algae | Na (mg g-1 dw) | Cl (mg g-1 dw) | Mg (mg g-1 dw) | K (mg g-1 dw) | Ca (mg g-1 dw) | P (mg g-1 dw) | ||||
| Microalgae | ||||||||||
| C. vulgaris | 2.02 ± 0.20 | 2.16 ± 0.21 | 7.52 ± 0.75 | 13.0 ± 1.50 | 2.20 ± 0.33 | 14.7 ± 2.24 | ||||
| H. pluvialis | 2.37 ± 0.23 | 1.98 ± 0.22 | 1.65 ± 0.25 | 4.28 ± 0.24 | 19.3 ± 1.11 | 13.4 ± 2.04 | ||||
| Isochrysis sp. | 30.7 ± 3.07 | 40.9 ± 4.08 | 6.36 ± 0.73 | 11.3 ± 0.65 | 7.68 ± 0.76 | 16.3 ± 1.88 | ||||
| N. gaditana | 45.1 ± 2.60 | 76.4 ± 7.63 | 9.54 ± 1.10 | 16.2 ± 1.62 | 4.89 ± 0.56 | 16.5 ± 0.95 | ||||
| Diatoms | ||||||||||
| P. tricornutum | 25.5 ± 2.55 | 32.5 ± 4.96 | 5.89 ± 0.34 | 22.3 ± 1.28 | 37.2 ± 5.68 | 14.1 ± 0.81 | ||||
| Skeletonema sp. | 28.8 ± 4.40 | 44.2 ± 5.11 | 5.42 ± 0.82 | 19.9 ± 1.14 | 11.1 ± 1.28 | 9.05 ± 1.04 | ||||
| Cyanobacteria | ||||||||||
| A. platensis | 3.28 ± 0.32 | 2.38 ± 0.27 | 2.88 ± 0.43 | 14.1 ± 1.41 | 1.08 ± 0.06 | 10.8 ± 1.08 | ||||
| Algae | Mn (mg kg-1 dw) | Fe (mg kg-1 dw) | B (mg kg-1 dw) | Zn (mg kg-1 dw) | Cu (mg kg-1 dw) | |||||
| Microalgae | ||||||||||
| C. vulgaris | 197.3 ± 30.1 | 952.0 ± 95.1 | nd | 31.5 ± 1.05 | 10.6 ± 0.41 | |||||
| H. pluvialis | 888.8 ± 58.8 | 3,091.4 ± 309.0 | nd | 918.2 ± 46.7 | 290.0 ± 14.7 | |||||
| Isochrysis sp. | 122.6 ± 18.7 | 7,725.4 ± 672.3 | 14.5 ± 2.21 | 341.4 ± 6.57 | 76.2 ± 3.87 | |||||
| N. gaditana | 211.3 ± 21.1 | 508.7 ± 50.8 | 15.1 ± 2.30 | 238.0 ± 9.19 | 19.3 ± 0.63 | |||||
| Diatoms | ||||||||||
| P. tricornutum | 586.8 ± 33.8 | 2,175.2 ± 332.1 | 38.0 ± 5.81 | 617.8 ± 20.5 | 59.6 ± 2.29 | |||||
| Skeletonema sp. | 179.9 ± 20.7 | 1,543.9 ± 154.2 | 8.15 ± 0.47 | 477.6 ± 15.9 | 32.1 ± 1.07 | |||||
| Cyanobacteria | ||||||||||
| A. platensis | 54.9 ± 5.48 | 491.7 ± 75.1 | 2.56 ± 0.29 | 27.3 ± 0.91 | 7.68 ± 0.29 | |||||
**Data represent the mean value of three samples (n=3) ± SE. “nd” indicates that the element was not detected.
Hormonal profile
The hormone concentrations showed a wide variability among species and are detailed in Table 3. ACC levels fluctuated between 43.2 ng g-1 dw and 3,161.9 ng g-1 dw, while Mel ranged from 2.30 ng g-1 dw to 82.0 ng g-1 dw. tZ showed values between 587.1 ng g-1 dw and 66,024.6 ng g-1 dw, and iP ranged from 15.6 ng g-1 dw to 2,242.4 ng g-1 dw. IAA recorded concentrations between 26.8 ng g-1 dw and 1,319.3 ng g-1 dw, while SA was found between 35.1 ng g-1 dw and 544.5 ng g-1 dw. In the gibberellin group, GA1 ranged from 6.76 ng g-1 dw to 91.5 ng g-1 dw, GA3 showed values between 4.67 ng g-1 dw and 678.4 ng g-1 dw, and GA4 ranged from 5.99 ng g-1 dw to 396.7 ng g-1 dw. On the other hand, ABA reached concentrations between 8.34 ng g-1 dw and 766.6 ng g-1 dw, and JA ranged from 5.42 ng g-1 dw to 2,232.6 ng g-1 dw. The results indicated that P. tricornutum showed the highest concentrations of ACC, iP, SA, GA3, and ABA. Similarly, H. pluvialis was characterized by having the highest levels of Mel, IAA, GA1, and GA4, while Isochrysis sp. stood out for recording the highest values of tZ and JA
Table 3. Hormonal profile of the different species studied (ng g-1 dw).
| Algae | ACC (ng g-1 dw) | Mel (ng g-1 dw) | tZ (ng g-1 dw) | iP (ng g-1 dw) | |||
| Microalgae | |||||||
| C. vulgaris | 43.2 ± 4.32 | nd | 10,858.9 ± 658.5 | 15.6 ± 0.89 | |||
| H. pluvialis | 564.1 ± 65.1 | 82.0 ± 12.5 | 9,621.6 ± 355.7 | 159.3 ± 24.3 | |||
| Isochrysis sp. | 2,908.5 ± 444.0 | 2.30 ± 0.26 | 66,024.6 ± 250.1 | 1,709.5 ± 98.6 | |||
| N. gaditana | nd | nd | 42,916.4 ± 412.3 | 19.8 ± 2.28 | |||
| Diatoms | |||||||
| P. tricornutum | 3,161.9 ± 482.2 | 66.8 ± 7.71 | 35,337.4 ± 340.5 | 2,242.4 ± 147.1 | |||
| Skeletonema sp. | 459.7 ± 42.1 | 12.2 ± 1.86 | 10,021.8 ± 156.0 | 279.9 ± 42.7 | |||
| Cyanobacteria | |||||||
| A. platensis | 173.7 ± 7.45 | 2.42 ± 0.36 | 587.1 ± 67.7 | 144.6 ± 16.6 | |||
| Algae | IAA (ng g-1 dw) | SA (ng g-1 dw) | GA1 (ng g-1 dw) | GA3 (ng g-1 dw) | |||
| Microalgae | |||||||
| C. vulgaris | 57.2 ± 5.71 | 164.2 ± 16.4 | nd | nd | |||
| H. pluvialis | 1,319.3 ± 201.1 | 281.6 ± 43.0 | 91.5 ± 10.5 | 141.1 ± 21.5 | |||
| Isochrysis sp. | 331.1 ± 50.5 | 35.1 ± 3.50 | 16.7 ± 0.96 | 25.0 ± 2.89 | |||
| N. gaditana | 37.8 ± 3.78 | 324.1 ± 37.4 | 15.5 ± 0.54 | 271.1 ± 41.4 | |||
| Diatoms | |||||||
| P. tricornutum | 836.3 ± 96.5 | 544.5 ± 54.4 | 84.1 ± 12.8 | 678.4 ± 78.3 | |||
| Skeletonema sp. | 29.5 ± 2.95 | 61.9 ± 9.45 | 6.76 ± 0.78 | 5.39 ± 0.53 | |||
| Cyanobacteria | |||||||
| A. platensis | 26.8 ± 4.09 | 42.6 ± 2.45 | 9.64 ± 0.55 | 4.67 ± 0.71 | |||
| Algae | GA4 (ng g-1 dw) | ABA (ng g-1 dw) | JA (ng g-1 dw) | ||||
| Microalgae | |||||||
| C. vulgaris | 270.7 ± 41.3 | 8.34 ± 1.27 | 5.42 ± 0.53 | ||||
| H. pluvialis | 273.1 ± 41.7 | 642.9 ± 64.2 | 1,605.6 ± 182.4 | ||||
| Isochrysis sp. | 38.9 ± 5.75 | 117.4 ± 13.5 | 2,232.6 ± 341.2 | ||||
| N. gaditana | 288.0 ± 33.2 | 64.2 ± 3.55 | 1,133.2 ± 65.6 | ||||
| Diatoms | |||||||
| P. tricornutum | 396.7 ± 60.6 | 766.6 ± 117.2 | 1,402.5 ± 214.0 | ||||
| Skeletonema sp. | 107.2 ± 10.7 | 83.0 ± 2.74 | 538.4 ± 33.5 | ||||
| Cyanobacteria | |||||||
| A. platensis | 5.99 ± 0.25 | 93.0 ± 10.7 | 415.5 ± 31.4 | ||||
**Data represent the mean value of three samples (n=3) ± SE. “nd” indicates that the element was not detected.
Metabolic profile
Amino acid profile
The amino acid analysis allowed for the determination of their concentrations in the different species. GABA levels ranged from 2.56 mg g-1 dw to 6.04 mg g-1 dw, while Ala showed a range from 0.74 mg g-1 dw to 22.3 mg g-1 dw. Asn reached concentrations between 0.66 mg g-1 dw and 6.13 mg g-1 dw, and Asp fluctuated between 0.35 mg g-1 dw and 5.83 mg g-1 dw. For Glu, the values ranged from 1.47 mg g-1 dw to 17.8 mg g-1 dw. Regarding essential amino acids, Ile showed a range from 0.14 mg g-1 dw to 6.60 mg g-1 dw, while Leu exhibited concentrations between 0.19 mg g-1 dw and 7.85 mg g-1 dw. Phe recorded a range from 0.13 mg g-1 dw to 4.21 mg g-1 dw, and Val presented values from 0.18 mg g-1 dw to 6.37 mg g-1 dw. On the other hand, Pro ranged from 0.10 mg g-1 dw to 21.3 mg g-1 dw, while Tyr showed concentrations from 0.09 mg g-1 dw to 3.97 mg g-1 dw (Table 4).
Among the species studied, Isochrysis sp. stood out for having a profile rich in most of the quantified amino acids, except for Glu, whose highest concentration was recorded in C. vulgaris; Gln (1.61 mg g-1 dw), which reached its highest value in Skeletonema sp.; and Pro, with the highest level observed in N. gaditana. Additionally, it is noteworthy that GABA was detected only in Isochrysis sp. and N. gaditana, while Gln was present exclusively in Skeletonema sp.
Table 4. Concentration of amino acids in the different species analyzed (mg g-1 dw).
| Algae | GABA (mg g-1 dw) | Ala (mg g-1 dw) | Asn (mg g-1 dw) | Asp (mg g-1 dw) | Glu (mg g-1 dw) | Gln (mg g-1 dw) | |||||
| Microalgae | |||||||||||
| C. vulgaris | nd | 5.68 ± 0.86 | 1.06 ± 0.06 | 1.35 ± 0.23 | 17.8 ± 1.02 | nd | |||||
| H. pluvialis | nd | 1.58 ± 0.24 | nd | 0.32 ± 0.05 | 1.47 ± 0.08 | nd | |||||
| Isochrysis sp. | 6.04 ± 0.34 | 22.3 ± 3.42 | 6.13 ± 0.35 | 5.83 ± 0.89 | 16.3 ± 2.49 | nd | |||||
| N. gaditana | 2.56 ± 0.14 | 2.61 ± 0.06 | 0.66 ± 0.03 | 0.92 ± 0.05 | 9.51 ± 1.09 | nd | |||||
| Diatoms | |||||||||||
| P. tricornutum | nd | 12.2 ± 1.87 | 3.11 ± 0.31 | 3.04 ± 0.17 | 15.7 ± 1.56 | nd | |||||
| Skeletonema sp. | nd | 4.90 ± 0.56 | 0.74 ± 0.11 | 0.86 ± 0.08 | 7.08 ± 1.08 | 1.61 ± 0.02 | |||||
| Cyanobacteria | |||||||||||
| A. platensis | nd | 0.74 ± 0.07 | nd | 0.35 ± 0.02 | 8.43 ± 0.48 | nd | |||||
| Algae | Ile (mg g-1 dw) | Leu (mg g-1 dw) | Phe (mg g-1 dw) | Val (mg g-1 dw) | Pro (mg g-1 dw) | Tyr (mg g-1 dw) | |||||
| Microalgae | |||||||||||
| C. vulgaris | 0.14 ± 0.02 | 0.19 ± 0.01 | 0.13 ± 0.02 | 0.57 ± 0.08 | 3.22 ± 0.32 | 0.37 ± 0.01 | |||||
| H. pluvialis | 0.44 ± 0.04 | 0.51 ± 0.05 | nd | 0.31 ± 0.04 | 0.47 ± 0.02 | 0.09 ± 0.001 | |||||
| Isochrysis sp. | 6.60 ± 1.00 | 7.85 ± 0.45 | 4.21 ± 0.32 | 6.37 ± 0.97 | 4.82 ± 0.27 | 3.97 ± 0.39 | |||||
| N. gaditana | 0.47 ± 0.05 | 0.70 ± 0.05 | 0.30 ± 0.04 | 0.74 ± 0.11 | 21.3 ± 2.46 | 0.29 ± 0.04 | |||||
| Diatoms | |||||||||||
| P. tricornutum | 1.94 ± 0.11 | 1.81 ± 0.27 | 0.93 ± 0.05 | 2.27 ± 0.22 | 7.99 ± 0.46 | 0.96 ± 0.11 | |||||
| Skeletonema sp. | 1.10 ± 0.16 | 0.90 ± 0.05 | nd | 0.50 ± 0.02 | 2.80 ± 0.32 | 0.47 ± 0.02 | |||||
| Cyanobacteria | |||||||||||
| A. platensis | 0.15 ± 0.02 | 0.26 ± 0.04 | nd | 0.18 ± 0.02 | 0.10 ± 0.01 | 0.12 ± 0.01 | |||||
**Data represent the mean value of three samples (n=3) ± SE. “nd” indicates that the element was not detected.
Organic acid profile
The organic acids quantified in microalgae, diatoms, and cyanobacteria are shown in Table 5. Regarding Ace, the levels ranged from 0.15 mg g-1 dw to 2.86 mg g-1 dw, while Cit showed values between 0.99 mg g-1 dw and 6.56 mg g-1 dw. On its part, For was found in a range from 0.01 ± 0.001 mg g-1 dw to 2.07 mg g-1 dw, Lac fluctuated between 0.42 mg g-1 dw and 12.5 mg g-1 dw, and Suc ranged from 1.24 mg g-1 dw to 4.05 mg g-1 dw.
The highest concentration of Ace was detected in A. platensis, and P. tricornutum showed the highest levels of Cit and Lac. The highest content of For was observed in Skeletonema sp., while Isochrysis sp. stood out for its level of Suc.
Table 5. Concentration of organic acids in the different species studied (mg g-1 dw).
| Algae | Ace (mg g-1 dw) | Cit (mg g-1 dw) | For (mg g-1 dw) | Lac (mg g-1 dw) | Suc (mg g-1 dw) |
| Microalgae | |||||
| C. vulgaris | 0.38 ± 0.04 | 3.91 ± 0.15 | 0.01 ± 0.001 | 3.50 ± 0.40 | 2.22 ± 0.12 |
| H. pluvialis | 1.25 ± 0.14 | nd | 1.56 ± 0.23 | 2.38 ± 0.27 | 1.24 ± 0.12 |
| Isochrysis sp. | 0.89 ± 0.05 | nd | 0.11 ± 0.001 | 5.05 ± 0.30 | 4.05 ± 0.46 |
| N. gaditana | 0.15 ± 0.001 | 2.40 ± 0.36 | 0.08 ± 0.01 | 0.42 ± 0.03 | 1.72 ± 0.19 |
| Diatoms | |||||
| P. tricornutum | 1.85 ± 0.28 | 6.56 ± 0.75 | 0.29 ± 0.02 | 12.5 ± 1.90 | 3.02 ± 0.46 |
| Skeletonema sp. | 1.71 ± 0.26 | 2.53 ± 0.38 | 2.07 ± 0.20 | 2.23 ± 0.25 | 3.69 ± 0.56 |
| Cyanobacteria | |||||
| A. platensis | 2.86 ± 0.16 | 0.99 ± 0.09 | 0.25 ± 0.02 | 3.12 ± 0.47 | nd |
**Data represent the mean value of three samples (n=3) ± SE. “nd” indicates that the element was not detected.
Sugars and other metabolites profile
The sugars detected by 1H-NMR, detailed in Table 6, showed differences in their composition among the different species. Glc concentrations were found in a range from 0.72 mg g-1 dw to 74.6 mg g-1 dw, while Man showed levels between 15.4 mg g-1 dw and 27.1 mg g-1 dw, and Sac reached values between 0.91 mg g-1 dw and 114.9 mg g-1 dw.
The species that presented the highest concentrations of these compounds were H. pluvialis for Fru (3.03 mg g-1 dw), Skeletonema sp. for Glc, N. gaditana for Man, and C. vulgaris for Sac. The presence of these compounds in the analyzed species confirmed that Fru was detected exclusively in H. pluvialis. Similarly, Man was observed only in N. gaditana and Skeletonema sp. On the other hand, Table 6 shows that the studied species also exhibited variations in their Bet and Tri profiles. Bet recorded values between 0.02 mg g-1 dw and 21.4 mg g-1 dw, while Tri fluctuated between 0.13 mg g-1 dw and 0.26 mg g-1 dw. In this case, N. gaditana presented the highest amount of Bet, while P. tricornutum showed the highest level of Tri, with it being detected only in P. tricornutum and Skeletonema sp.
Table 6. Concentration of sugars and other metabolites in the different species analyzed (mg g-1 dw).
| Algae | Fru (mg g-1 dw) | Glc (mg g-1 dw) | Man (mg g-1 dw) | Sac (mg g-1 dw) | Bet (mg g-1 dw) | Tri (mg g-1 dw) |
| Microalgae | ||||||
| C. vulgaris | nd | nd | nd | 114.9 ± 6.63 | 0.02 ± 0.001 | nd |
| H. pluvialis | 3.03 ± 0.46 | 5.61 ± 0.33 | nd | 1.64 ± 0.25 | nd | nd |
| Isochrysis sp. | nd | nd | nd | nd | 0.53 ± 0.03 | nd |
| N. gaditana | nd | 2.22 ± 0.02 | 27.1 ± 1.56 | nd | 21.4 ± 3.26 | nd |
| Diatoms | ||||||
| P. tricornutum | nd | 8.01 ± 0.92 | nd | 0.91 ± 0.05 | 18.5 ± 2.83 | 0.26 ± 0.02 |
| Skeletonema sp. | nd | 74.6 ± 1.25 | 15.4 ± 2.36 | nd | 0.90 ± 0.13 | 0.13 ± 0.01 |
| Cyanobacteria | ||||||
| A. platensis | nd | 0.72 ± 0.04 | nd | 1.46 ± 0.16 | 0.46 ± 0.04 | nd |
**Data represent the mean value of three samples (n=3) ± SE. “nd” indicates that the element was not detected.
Carbohydrate profile
Among the species analyzed, the concentrations of the different monosaccharides, polysaccharides, and uronic acids varied considerably. Arabinose showed levels between 2.93 g 100g-1 dw and 3.58 g 100g-1 dw, while fucose was found in a range from 5.46 g 100g-1 dw to 7.39 g 100g-1 dw. Rhamnose presented values between 1.71 g 100g-1 dw and 3.34 g 100g-1 dw, and xylose showed concentrations from 3.62 g 100g-1 dw to 4.68 g 100g-1 dw. Regarding fucoidans, their content ranged from 6.50 g 100g-1 dw to 8.91 g 100g-1 dw, while laminarin was found in a range from 0.97 g 100g-1 dw to 1.96 g 100g-1 dw. On the other hand, alginic acid presented values between 22.9 g 100g-1 dw and 43.3 g 100g-1 dw. Additionally, galacturonic acid ranged from 6.11 g 100g-1 dw to 7.67 g 100g-1 dw, glucuronic acid showed an interval from 1.20 g 100g-1 dw to 1.88 g 100g-1 dw, and iduronic acid ranged from 0.20 g 100g-1 dw to 1.77 g 100g-1 dw (Table 7). Table 7 shows that some species presented higher concentrations of certain compounds compared to others. N. gaditana had the highest value of arabinose, and Isochrysis sp. showed the highest levels of fucose, galacturonic acid, and glucuronic acid. H. pluvialis had the highest amount of rhamnose, while C. vulgaris recorded the highest concentrations of xylose and fucoidans. On the other hand, P. tricornutum stood out for its content of laminarin, alginic acid, and iduronic acid.
Table 7. Concentration of monosaccharides, polysaccharides, and uronic acids in the different species studied (g 100g-1 dw).
| Algae | Arabinose (g 100g-1 dw) | Fucose (g 100g-1 dw) | Rhamnose (g 100g-1 dw) | Xylose (g 100g-1 dw) | Fucoidans (g 100g-1 dw) | |||||
| Microalgae | ||||||||||
| C. vulgaris | 3.24 ± 0.24 | 7.07 ± 0.31 | 2.48 ± 0.25 | 4.68 ± 0.51 | 8.91 ± 0.65 | |||||
| H. pluvialis | 2.93 ± 0.48 | 6.09 ± 0.97 | 3.34 ± 0.22 | 4.50 ± 0.36 | 7.00 ± 1.27 | |||||
| Isochrysis sp. | 3.14 ± 0.33 | 7.39 ± 0.27 | 2.88 ± 0.16 | 4.41 ± 0.05 | 6.50 ± 1.58 | |||||
| N. gaditana | 3.58 ± 0.46 | 5.73 ± 0.68 | 2.17 ± 0.28 | 3.62 ± 0.34 | 6.90 ± 0.78 | |||||
| Diatoms | ||||||||||
| P. tricornutum | 3.38 ± 0.43 | 5.46 ± 0.86 | 1.71 ± 0.12 | 4.50 ± 1.06 | 8.50 ± 1.13 | |||||
| Skeletonema sp. | 3.14 ± 0.48 | 7.24 ± 0.75 | 2.76 ± 0.13 | 4.53 ± 0.24 | 7.83 ± 0.48 | |||||
| Cyanobacteria | ||||||||||
| A. platensis | 3.13 ± 0.36 | 7.14 ± 0.03 | 2.27 ± 0.23 | 4.38 ± 0.16 | 8.71 ± 0.50 | |||||
| Algae | Laminarin (g 100g-1 dw) | Alginic acid (g 100g-1 dw) | Galacturonic acid (g 100g-1 dw) | Glucuronic acid (g 100g-1 dw) | Iduronic acid (g 100g-1 dw) | |||||
| Microalgae | ||||||||||
| C. vulgaris | 1.27 ± 0.06 | 22.9 ± 2.04 | 6.82 ± 0.46 | 1.47 ± 0.21 | 0.30 ± 0.03 | |||||
| H. pluvialis | 1.39 ± 0.14 | 34.7 ± 3.65 | 6.29 ± 1.34 | 1.31 ± 0.13 | 0.26 ± 0.03 | |||||
| Isochrysis sp. | 1.33 ± 0.07 | 31.8 ± 2.72 | 7.67 ± 0.10 | 1.88 ± 0.13 | 0.20 ± 0.01 | |||||
| N. gaditana | 1.33 ± 0.13 | 36.3 ± 4.38 | 6.90 ± 1.10 | 1.55 ± 0.13 | 0.40 ± 0.02 | |||||
| Diatoms | ||||||||||
| P. tricornutum | 1.96 ± 0.06 | 43.3 ± 2.93 | 7.52 ± 0.56 | 1.20 ± 0.11 | 1.77 ± 0.11 | |||||
| Skeletonema sp. | 0.97 ± 0.10 | 37.0 ± 2.74 | 6.11 ± 0.50 | 1.64 ± 0.23 | 0.20 ± 0.01 | |||||
| Cyanobacteria | ||||||||||
| A. platensis | 1.90 ± 0.12 | 39.1 ± 4.06 | 6.96 ± 0.88 | 1.69 ± 0.22 | 0.22 ± 0.01 | |||||
**Data represent the mean value of three samples (n=3) ± SE.
To facilitate a comparative interpretation of the biochemical data, a summary table (Table 8) was included, highlighting the main parameters and distinctive features of each algal species. This table provides an overview of protein, phenolic, vitamin, sugar, and antioxidant contents, allowing a clear visualization of the biochemical variability among the studied taxa and their potential functional relevance for biostimulant applications.
Table 8. Comparative summary of key biochemical parameters in the studied species.
| Species | Proteins (mg g⁻¹ dw) | Total Phenols (mg g⁻¹ dw) | Reducing Sugars (mg g⁻¹ dw) | Vitamins (A + C) (mg g⁻¹ dw) | Antioxidant Activity (% inhibition) | Major Metabolites / Features |
| C. vulgaris | 13.6 | 1.11 | 4.09 | 10.0 | 14 | High sucrose, xylose |
| H. pluvialis | 14.0 | 1.46 | 11.7 | 9.9 | 7 | High auxins, gibberellins |
| Isochrysis sp. | 20.5 | 6.67 | 5.79 | 75.3 | 14 | Rich in vitamins, amino acids |
| N. gaditana | 21.6 | 2.01 | 3.32 | 19.2 | 13 | High proline, betaine |
| P. tricornutum | 22.4 | 3.95 | 9.02 | 20.0 | 14 | High minerals, ABA, laminarin |
| Skeletonema sp. | 22.8 | 6.90 | 18.2 | 26.0 | 13 | Rich in phenols, proteins |
| A. platensis | 14.6 | 1.31 | 4.19 | 19.1 | 14 | High acetate, phycobiliproteins |
Discussion
In recent years, microalgae, diatoms, and cyanobacteria have garnered increasing interest as raw materials for the formulation of biostimulant products due to their ability to enhance germination, plant growth, productivity, and nutrient use efficiency, as well as to increase tolerance to abiotic stresses. The biostimulant activity of extracts from these species has been linked to their content of bioactive compounds, such as total phenols, proteins, vitamins, reducing sugars, antioxidant activity, mineral nutrients, hormones, amino acids, organic acids, sugars, osmolytes, monosaccharides, polysaccharides, and uronic acids [12]. For example, extracts from the microalga C. vulgaris and the cyanobacterium A. platensis, rich in compounds such as proteins, amino acids, and minerals, have been shown to promote the growth and development of Vigna radiata [30]. However, although these extracts are increasingly used as biostimulants, few species have been thoroughly characterized in terms of their composition.
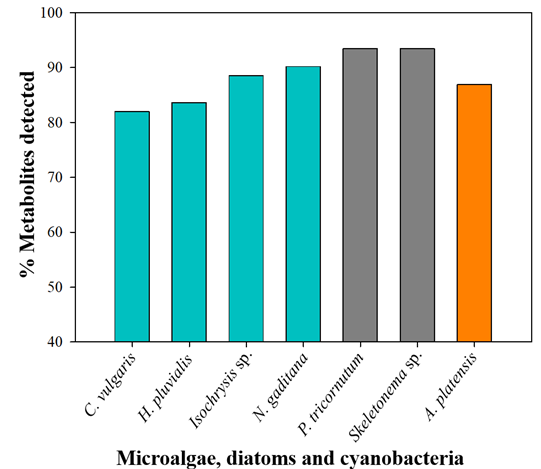
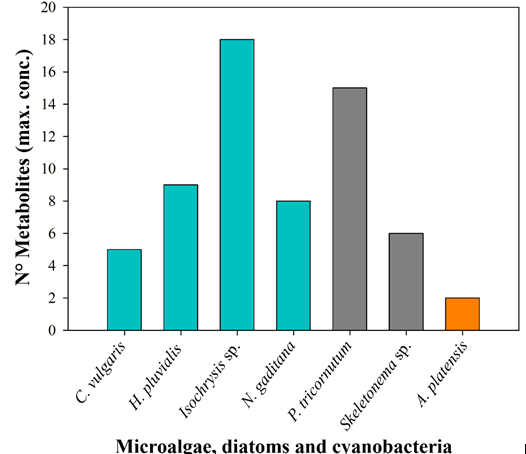
The results of this study provide detailed information on the biochemical composition and properties of different species of microalgae, diatoms, and cyanobacteria. The metabolite analysis revealed a remarkable biochemical diversity among species. P. tricornutum and Skeletonema sp. stood out for having the highest number of detected bioactive compounds, with 93% in both (Figure 1), while Isochrysis sp. and P. tricornutum showed the highest concentrations of several key metabolites, 18 and 15 respectively (Figure 2). In particular, Isochrysis sp. exhibited the highest levels of vitamin A, vitamin C, Fe, tZ, JA, GABA, Ala, Asn, Asp, Ile, Leu, Phe, Tyr, Suc, fucose, galacturonic acid, and glucuronic acid. On the other hand, P. tricornutum was characterized by its high content of K, Ca, B, ACC, iP, SA, GA3, ABA, Cit, Lac, Tri, laminarin, alginic acid, and iduronic acid. Additionally, both species showed a higher antioxidant activity. Their differentiated biochemical profiles can be used in various applications, especially in agriculture.
Biochemical profile
Phenolic compounds are secondary metabolites abundant in plants that participate in various physiological processes, such as protection against oxidative stress, growth improvement, productivity, and crop quality. Additionally, these compounds enhance plant adaptation and resistance to adverse environmental conditions [31]. In this study, Skeletonema sp. showed the highest phenolic content, within the range reported Cardoso et al. [32] and Del Mondo et al. [33], which could be of interest for biostimulant applications aimed at enhancing plant performance and stress tolerance. Furthermore, protein content varies considerably among species of microalgae, diatoms, and cyanobacteria, and is influenced by cultivation conditions. Many of these species can reach high protein levels, ranging from 40% to 60% of dry matter, although some exhibit lower levels [34]. In a study conducted by Becker [35], a protein range of 10% to 71% was recorded in 33 species of microalgae, diatoms, and cyanobacteria. In this context, an extract from the microalga N. gaditana [36] and the hydrolyzed biomass of the cyanobacterium A. platensis [37] have been used in the development of biostimulant products due to their high protein content. According to the results obtained in this study, the diatom Skeletonema sp. could also be considered a promising raw material for the production of such products, as its high protein content may support nitrogen-related processes and contribute to plant growth promotion.
Additionally, these photosynthetic microorganisms represent an important source of vitamins, essential compounds that play various biological functions, such as coenzymes, hormones, antioxidants, and regulators of cell growth. These vitamins are classified into two major groups: water-soluble (A, D, E, and K) and fat-soluble (C and B) [38]. In the present study, vitamins A and C were analyzed in various species of microalgae, diatoms, and cyanobacteria, with Isochrysis sp. standing out as the species with the highest concentration of these vitamins. However, our results differ from previous studies, which reported that Isochrysis sp. exhibits lower levels of vitamins A and C as compared to other species of microalgae and diatoms [39,40]. This difference could be explained by the environmental conditions during the cultivation of the microalga, as factors such as light, temperature, salinity, and UV radiation directly influence the synthesis of these compounds [38].
Regarding antioxidant capacity, the results obtained in our research showed that C. vulgaris, Isochrysis sp., P. tricornutum, and A. platensis stood out for having the highest levels, all with 14%. In Isochrysis sp., this activity appears to be mainly related to the concentration of phenolic compounds, supporting the idea that these compounds are key for protection against oxidative stress [41]. However, in the other species studied, antioxidant capacity could be influenced by other compounds, such as carotenoids [42] and lipids [43], which also play an important role in the antioxidant activity of microalgae, diatoms, and cyanobacteria. Overall, these species have a great potential to reduce oxidative damage in plants, supporting their possible use in biostimulant formulations targeting stress mitigation.
Mineral analysis
Macronutrients and micronutrients are essential for the proper growth and development of plants. In this study, it was observed that N. gaditana exhibits high levels of Na and Cl, which could limit its applicability in saline soils. However, it stands out for its high content of Mg and P, which are important for photosynthesis, energy metabolism, and root development. P. tricornutum, on the other hand, was found to be rich in K and Ca, which are essential for osmotic regulation, photosynthesis, and resistance to abiotic and biotic stress.
Regarding the micronutrients, H. pluvialis showed the highest levels of Mn, Zn, and Cu, which are associated with photosynthesis, antioxidant defense, carbohydrate transformation, and root metabolism. On the other hand, Isochrysis sp. and P. tricornutum exhibited high concentrations of Fe and B, which are essential for chlorophyll formation, photosynthesis, and the development of fruits and seeds.
Due to their nutritional composition, the species studied could contribute to improving agricultural performance and plant tolerance to adverse environmental conditions [44]. An example of this is the study by Mulbry et al. [45], which demonstrated that microalgal biomass applied to maize crops provided essential nutrients such as nitrogen, phosphorus, and potassium, promoting plant growth.
Hormonal profile
Phytohormones, such as cytokinins, auxins, salicylates, gibberellins, and jasmonates, are signaling molecules that regulate various physiological processes in plants at low concentrations [46]. Their presence has been documented in microalgae, diatoms, and cyanobacteria [47,48]. In this regard, it has been observed that the foliar application of extracts from the microalgae C. vulgaris and N. salina, and from the cyanobacterium A. platensis, which contain auxins, gibberellins, and other bioactive compounds, can enhance growth, yield, and antioxidant capacity in common bean plants [49].
In the present study, the hormonal profile of various species of microalgae, diatoms, and cyanobacteria was characterized. P. tricornutum and Isochrysis sp. showed the highest levels of the cytokinins tZ and iP, which are essential for cell division and the delay of senescence [50]. H. pluvialis stood out for its content of IAA and gibberellins GA1 and GA4, which are involved in root growth, cell elongation, and the development of reproductive organs [51,52]. On the other hand, P. tricornutum showed the highest concentrations of ABA, a hormone essential in the response to stress and plant senescence [53]. The observed results indicate their potential to influence various physiological processes in agricultural crops.
Metabolic profile
The microalgae Isochrysis sp. and N. gaditana, as well as the diatom Skeletonema sp., stood out for their amino acid profile. Among them, Isochrysis sp. exhibited the highest concentrations of most of the quantified amino acids, except for Pro and Gln, which were mainly detected in N. gaditana and Skeletonema sp., respectively. In Isochrysis sp., the most abundant amino acids were Ala and Glu. Ala, associated with chlorophyll synthesis and photosynthetic activity, also contributes to the protection of plants against abiotic stresses [54], while Glu, which participates in cell signaling, is essential for nitrogen homeostasis and enables plants to adapt to variations in nitrogen levels in their tissues and in the soil [55]. On the other hand, Pro is essential in stress situations, playing a role in membrane protection and the deactivation of reactive oxygen species (ROS) [56], and Gln is involved in nitrogen assimilation, the biosynthesis of amino acids, nucleotides, and vitamins, as well as in the regulation of metabolism and stress responses [57]. Thanks to these properties, microalgae and diatoms with a high content of these amino acids could be used in the development of biostimulant products. In the study by Alfosea-Simón et al. [25], the foliar application of Glu improved CO2 assimilation and the growth of tomato plants, and it was suggested that the combination of different amino acids could generate synergistic effects on plant metabolism.
Among the organic acids, acetate, citrate, and succinate have been widely studied for their role in plant physiology and their ability to improve plant responses to various environmental factors. For example, a study in soybean demonstrated that the foliar application of acetic acid helps mitigate the effects of drought by improving water use efficiency, reducing oxidative stress, and enhancing photosynthetic capacity [58]. Similarly, in Talebi et al. [59], it was determined that the foliar application of citric acid in Gazania rigens improved plant growth, increasing root biomass, root:shoot ratio, and flowering duration. Furthermore, it has been observed that the exogenous application of succinic acid can enhance tolerance to heavy metal stress in Larix olgensis, by reducing cadmium accumulation in plant tissues and protecting membrane integrity under toxicity conditions, as described by Duan et al. [60]. The analysis of the studied species showed that acetate was predominantly found in A. platensis, citrate in P. tricornutum, and succinate in Isochrysis sp.
On the other hand, Skeletonema sp. exhibited the highest concentration of glucose among the species analyzed. This result could be attributed to the presence of laminarins, glucose-rich reserve polysaccharides described in species of the same genus [61]. In addition, in other diatoms such as P. tricornutum, glucose has been associated with structural polysaccharides such as hemicelluloses, which reinforces its possible dual function as both a reserve and structural component in this species [62]. Similarly, C. vulgaris exhibited the highest concentration of sucrose. This finding is consistent with previous studies that demonstrated the ability of this microalga to synthesize and accumulate sucrose, especially in response to stress factors such as salinity or exposure to low temperatures, where it plays a role in regulating the osmotic balance of the cell [63,64]. Such sugar profiles may contribute to improved stress tolerance and metabolic efficiency in crops.
The accumulation of osmoprotectants such as betaine is crucial for the adaptation of microalgae to abiotic stress. In this study, N. gaditana stood out for its high levels of betaine, suggesting that this species has a strong capacity to tolerate stress conditions. Jiménez-Arias et al. [65] describe the role of glycine-betaine as an osmoprotectant in algae, which helps maintain cellular integrity against adverse environmental factors. Regarding trigonelline, a metabolite with osmoprotective properties, it was detected only in diatoms, indicating that this compound may play a role in the adaptation of these species to environmental stress situations. Although trigonelline has been previously described in some species of phytoplankton, including certain diatoms, it has been found in lower concentrations as compared to other more common osmoprotectants such as glycine-betaine, which is consistent with the results obtained in this study [66]. These compounds could be of interest for biostimulant formulations aimed at improving plant performance under challenging environmental conditions.
Carbohydrate profile
The carbohydrates present in microalgae, diatoms, and cyanobacteria, including exopolysaccharides, have attracted growing interest due to their structural diversity and bioactive potential. Polysaccharides can serve structural functions, as part of the cell wall or energy storage, and in many cases, they are released into the environment as protective mechanisms against stress conditions. Their composition depends on factors such as species and cultivation conditions, and they are primarily composed of monosaccharides such as glucose, xylose, and galactose, along with others such as arabinose, fucose, and rhamnose, as well as uronic acid residues, mainly galacturonic and glucuronic acids [67,68,69]. In recent years, numerous studies have shown that the polysaccharides and exopolysaccharides produced by microalgae and cyanobacteria possess biostimulant properties and exert positive effects on plant growth, promoting the development of both aerial and root biomass, improving tolerance to stress conditions such as salinity, and modulating the activity of antioxidant enzymes, as observed in tomato and pepper crops [70,71]. Furthermore, strains of Chlorella sp. and Chlamydomonas reinhardtii have been shown to produce exopolysaccharides and auxins, contributing to enhanced flowering, fruit size, pigment content, and photosynthetic performance in tomato tomato plants [72].
The analysis of the carbohydrates present in the different species of microalgae, diatoms, and cyanobacteria allowed for the identification of a variety of monosaccharides, polysaccharides, and uronic acids, showing differences in their composition. In N. gaditana, a high concentration of arabinose was detected, a monosaccharide that is poorly documented in this species, although in other species of the same genus, other monosaccharides such as fucose, rhamnose, xylose, mannose, and galactose have been identified [26,73]. On its part, Isochrysis sp. showed the highest levels of fucose, galacturonic acid, and glucuronic acid, compounds that could be related to the presence of sulfated polysaccharides, which have been previously identified in this microalga [68,74]. In the case of H. pluvialis, the highest content of rhamnose was observed, a monosaccharide that has not been previously documented in this species, although other studies have described monosaccharides such as glucose, arabinose, mannose, and ribose [75]. Similarly, C. vulgaris exhibited high values of xylose and fucoidans. Xylose has been widely documented in this species, while the identification of fucoidans, characteristic of brown algae, aligns with previous studies in the Chlorella genus, which suggest the possible presence of sulfated polysaccharides [26,73]. On the other hand, P. tricornutum showed the highest concentration of laminarin, alginic acid, and iduronic acid. The detection of laminarin corresponds to the production of chrysolaminarin in diatoms [68,73], while alginic acid and iduronic acid have not been previously described in this species.
One limitation of this study is the lack of specific information regarding the strain identity and cultivation conditions of the biomass, as the samples were obtained from commercial suppliers. In addition, the biochemical characterization was performed under controlled laboratory conditions, and therefore, variations in environmental factors under large-scale or field cultivation could modify the biochemical composition of the microalgae. Nonetheless, the biochemical characterization of these commercially available materials provides valuable insights for their potential application in the development of biostimulant formulations. For instance, applications of Chlorella vulgaris, Scenedesmus vacuolatus and Coelastrella sp. have shown improvement in yield and fruit quality in strawberry crops [76]. Similar positive outcomes have been reported in sugar beet, where extracts from Chlorella vulgaris and Scenedesmus quadricauda improved root traits and modulated gene expression related to nutrient acquisition [77]. Future work should therefore focus on validating these biochemical traits under field or greenhouse conditions to better understand their consistency and agronomic relevance. The results obtained in this study are consistent with previous research demonstrating the potential of algal-derived biostimulants to improve plant performance. For instance, extracts from Chlorella vulgaris and Nannochloropsis salina have been shown to enhance growth, yield, and antioxidant capacity in common bean and tomato crops, respectively [49,72]. Likewise, diatom-based formulations such as those derived from Skeletonema sp. have exhibited strong biostimulant and antioxidant properties associated with their rich content of phenolic compounds and polysaccharides [32]. Moreover, the positive agronomic effects of microalgae-based biofertilizers, including improved nutrient uptake and stress tolerance, have been documented in several horticultural species [70,71,76,77]. These findings are in agreement with our results, reinforcing the potential of microalgal, diatom, and cyanobacterial biomass as valuable sources of bioactive compounds for sustainable agriculture.
Conclusions
In this study, the biochemical composition of the biomass of different species of microalgae, diatoms, and cyanobacteria was analyzed. The results reveal a great diversity of bioactive compounds, such as phenols, proteins, vitamins, mineral nutrients, hormones, metabolites, and carbohydrates, which contribute to plant growth and development, as well as tolerance to environmental stress. Among the species analyzed, P. tricornutum and Skeletonema sp. stood out for having the highest diversity of detected bioactive compounds, while Isochrysis sp. and P. tricornutum showed the highest concentrations of various metabolites. Similarly, H. pluvialis presented the highest levels of auxins and gibberellins, and N. gaditana stood out for its content of proline and betaine. Likewise, A. platensis was characterized by its high content of acetate, while C. vulgaris proved to be an important source of sucrose and xylose. The variability observed in the biochemical profiles of these species promotes the development of more specific and effective biofertilizers and biostimulants, tailored to the needs of crops and soil, and represents a promising alternative for advancing towards more sustainable agricultural systems. Based on their biochemical profiles, different species show potential for specific agricultural uses, such as growth promotion or stress tolerance. However, further studies are needed to define precise applications. Overall, the biochemical characterization of different microalgal, diatom, and cyanobacterial species revealed significant variability in their profiles of proteins, phenolics, vitamins, and phytohormones, which may influence their biostimulant potential. These findings highlight the relevance of species selection when developing new formulations for sustainable crop production. Future research should focus on formulating and testing biostimulant products derived from these biomasses under greenhouse and field conditions, in order to validate their agronomic performance and optimize their practical use in different crops and environments.
Acknowledgments: This project was funded by the Ministry of Science and Innovation under the Collaborative Challenges call. Project: Formulation of new biostimulant products with seaweed extracts for citrus and horticultural crops irrigated with non-conventional waters (BIOBORO). RTC2019-006954-2. This study also forms part of the ThinkinAzul programme and was supported by MCIN with funding from the European Union NextGeneration EU and by Fundación Séneca – Comunidad Autónoma de la Región de Murcia.
References
- Queiroz, M.I.; Vieira, J.G.; Maroneze, M.M. Morphophysiological, Structural, and Metabolic Aspects of Microalgae. In Handbook of Microalgae-Based Processes and Products; Elsevier: Amsterdam, The Netherlands, 2020; pp. 25–48.
- Safi, C.; Zebib, B.; Merah, O.; Pontalier, P.-Y.; Vaca-Garcia, C. Morphology, Composition, Production, Processing and Applications of Chlorella vulgaris: A Review. Renewable and Sustainable Energy Reviews 2014, 35, 265–278.
- Han, D.; Li, Y.; Hu, Q. Biology and Commercial Aspects of Haematococcus Pluvialis. In Handbook of Microalgal Culture; Richmond, A., Hu, Q., Eds.; Wiley: Hoboken, NJ, USA, 2013; pp. 388–405.
- Lopez, P. J.; Descles, J.; Allen, A. E.; Bowler, C. Prospects in diatom research. Current opinion in Biotechnology 2005, 16, 180-186.
- Butler, T.; Kapoore, R.V.; Vaidyanathan, S. Phaeodactylum tricornutum: A Diatom Cell Factory. Trends in Biotechnology 2020, 38, 606–622.
- Bhattacharjya, R.; Kiran Marella, T.; Tiwari, A.; Saxena, A.; Kumar Singh, P.; Mishra, B. Bioprospecting of Marine Diatoms Thalassiosira, Skeletonema and Chaetoceros for Lipids and Other Value-Added Products. Bioresource Technology 2020, 318, 124073.
- Whitton, B.A. Ecology of Cyanobacteria II: Their Diversity in Space and Time; Springer Netherlands: Dordrecht, The Netherlands, 2012.
- Pan-utai, W.; Iamtham, S. Extraction, Purification and Antioxidant Activity of Phycobiliprotein from Arthrospira platensis. Process Biochemistry 2019, 82, 189–198.
- Rippka, R.; Deruelles, J.; Waterbury, John B., R.; Herdman, M.; Stanier, J.B. Generic Assignments, Strain Histories and Properties of Pure Cultures of Cyanobacteria. Microbiology 1979, 111, 1–61.
- Yakhin, O.I.; Lubyanov, A.A.; Yakhin, I.A.; Brown, P.H. Biostimulants in Plant Science: A Global Perspective. Front. Plant Sci. 2017, 7.
- Rouphael, Y.; Colla, G. Synergistic Biostimulatory Action: Designing the Next Generation of Plant Biostimulants for Sustainable Agriculture. Front. Plant Sci. 2018, 9, 1655.
- Chiaiese, P.; Corrado, G.; Colla, G.; Kyriacou, M.C.; Rouphael, Y. Renewable Sources of Plant Biostimulation: Microalgae as a Sustainable Means to Improve Crop Performance. Front. Plant Sci. 2018, 9, 1782.
- Guzmán-Murillo, M.A.; Ascencio, F.; Larrinaga-Mayoral, J.A. Germination and ROS Detoxification in Bell Pepper (Capsicum annuum L.) under NaCl Stress and Treatment with Microalgae Extracts. Protoplasma 2013, 250, 33–42.
- Mutale-joan, C.; Redouane, B.; Najib, E.; Yassine, K.; Lyamlouli, K.; Laila, S.; Zeroual, Y.; Hicham, E.A. Screening of Microalgae Liquid Extracts for Their Biostimulant Properties on Plant Growth, Nutrient Uptake and Metabolite Profile of Solanum lycopersicum L. Sci Rep 2020, 10, 2820.
- Singleton, V.L.; Orthofer, R.; Lamuela-Raventós, R.M. [14] Analysis of Total Phenols and Other Oxidation Substrates and Antioxidants by Means of Folin-Ciocalteu Reagent. In Methods in Enzymology; Elsevier: Amsterdam, The Netherlands, 1999; Volume 299, pp. 152–178.
- Bradford, M.M. A Rapid and Sensitive Method for the Quantitation of Microgram Quantities of Protein Utilizing the Principle of Protein-Dye Binding. 1976, 72, 248–254.
- Rutkowski, M.; Grzegorczyk, K. Modifications of spectrophotometric methods for antioxidative vitamins determination convenient in analytic practice. 2007.
- Gillespie, K.M.; Ainsworth, E.A. Measurement of Reduced, Oxidized and Total Ascorbate Content in Plants. Nat Protoc 2007, 2, 871–874.
- Nelson, N. A photometric adaptation of the somogyi method for the determination of glucose. Journal of Biological Chemistry 1944, 153, 375–380.
- Somogyi, M. Notes on sugar determination. Journal of Biological Chemistry 1952, 195, 19–23.
- Brand-Williams, W.; Cuvelier, M.E.; Berset, C. Use of a Free Radical Method to Evaluate Antioxidant Activity. LWT – Food Science and Technology 1995, 28, 25–30.
- Albacete, A.; Ghanem, M.E.; Martinez-Andujar, C.; Acosta, M.; Sanchez-Bravo, J.; Martinez, V.; Lutts, S.; Dodd, I.C.; Perez-Alfocea, F. Hormonal Changes in Relation to Biomass Partitioning and Shoot Growth Impairment in Salinized Tomato (Solanum lycopersicum L.) Plants. Journal of Experimental Botany 2008, 59, 4119–4131.
- Martínez‐Andújar, C.; Martínez‐Pérez, A.; Albacete, A.; Martínez‐Melgarejo, P.A.; Dodd, I.C.; Thompson, A.J.; Mohareb, F.; Estelles‐Lopez, L.; Kevei, Z.; Ferrández‐Ayela, A.; et al. Overproduction of ABA in Rootstocks Alleviates Salinity Stress in Tomato Shoots. Plant Cell & Environment 2021, 44, 2966–2986.
- van der Sar, S.; Kim, H.K.; Meissner, A.; Verpoorte, R.; Choi, Y.H. Nuclear Magnetic Resonance Spectroscopy for Plant Metabolite Profiling. In The Handbook of Plant Metabolomics; Weckwerth, W., Kahl, G., Eds.; Wiley: Hoboken, NJ, USA, 2013; pp. 57–76.
- Alfosea-Simón, M.; Simón-Grao, S.; Zavala-Gonzalez, E.A.; Cámara-Zapata, J.M.; Simón, I.; Martínez-Nicolás, J.J.; Lidón, V.; García-Sánchez, F. Physiological, Nutritional and Metabolomic Responses of Tomato Plants After the Foliar Application of Amino Acids Aspartic Acid, Glutamic Acid and Alanine. Front. Plant Sci. 2021, 11, 581234.
- Templeton, D.W.; Quinn, M.; Van Wychen, S.; Hyman, D.; Laurens, L.M.L. Separation and Quantification of Microalgal Carbohydrates. Journal of Chromatography A 2012, 1270, 225–234.
- Zayed, A.; Muffler, K.; Hahn, T.; Rupp, S.; Finkelmeier, D.; Burger-Kentischer, A.; Ulber, R. Physicochemical and Biological Characterization of Fucoidan from Fucus Vesiculosus Purified by Dye Affinity Chromatography. Marine Drugs 2016, 14, 79.
- Albalasmeh, A.A.; Berhe, A.A.; Ghezzehei, T.A. A New Method for Rapid Determination of Carbohydrate and Total Carbon Concentrations Using UV Spectrophotometry. Carbohydrate Polymers 2013, 97, 253–261.
- Volpi, N. Micellar Electrokinetic Capillary Chromatography Determination of Alginic Acid in Pharmaceutical Formulations after Treatment with Alginate Lyase and UV Detection. Electrophoresis 2008, 29, 3504–3510.
- Dineshkumar, R.; Duraimurugan, M.; Sharmiladevi, N.; Lakshmi, L.P.; Rasheeq, A.A.; Arumugam, A.; Sampathkumar, P. Microalgal Liquid Biofertilizer and Biostimulant Effect on Green Gram (Vigna radiata L.) an Experimental Cultivation. Biomass Conv. Bioref. 2022, 12, 3007–3027.
- Cichoński, J.; Chrzanowski, G. Microalgae as a Source of Valuable Phenolic Compounds and Carotenoids. Molecules 2022, 27, 8852.
- Cardoso, C.; Pereira, H.; Franca, J.; Matos, J.; Monteiro, I.; Pousão-Ferreira, P.; Gomes, A.; Barreira, L.; Varela, J.; Neng, N.; et al. Lipid Composition and Some Bioactivities of 3 Newly Isolated Microalgae (Tetraselmis sp. IMP3, Tetraselmis sp. CTP4, and Skeletonema sp.). Aquacult Int 2020, 28, 711–727.
- Del Mondo, A.; Smerilli, A.; Ambrosino, L.; Albini, A.; Noonan, D.M.; Sansone, C.; Brunet, C. Insights into Phenolic Compounds from Microalgae: Structural Variety and Complex Beneficial Activities from Health to Nutraceutics. Critical Reviews in Biotechnology 2021, 41, 155–171.
- Wang, Y.; Tibbetts, S.; McGinn, P. Microalgae as Sources of High-Quality Protein for Human Food and Protein Supplements. Foods 2021, 10, 3002.
- Becker, E.W. Microalgae for Human and Animal Nutrition. In Handbook of Microalgal Culture; Richmond, A., Hu, Q., Eds.; Wiley: Hoboken, NJ, USA, 2013; pp. 461–503.
- Valero-Vizcaino, A.; Villaró-Cos, S.; Morillas-España, A.; Cerdá-Moreno, C.; Lafarga, T. Production of Techno-Functional Proteins and Plant Biostimulants from Nannochloropsis gaditana. Food Bioscience 2024, 59, 104000.
- Mógor, Á.F.; Ördög, V.; Lima, G.P.P.; Molnár, Z.; Mógor, G. Biostimulant Properties of Cyanobacterial Hydrolysate Related to Polyamines. J Appl Phycol 2018, 30, 453–460.
- Del Mondo, A.; Smerilli, A.; Sané, E.; Sansone, C.; Brunet, C. Challenging Microalgal Vitamins for Human Health. Microb Cell Fact 2020, 19, 201.
- De Roeck-Holtzhauer, Y.; Quere, I.; Claire, C. Vitamin Analysis of Five Planktonic Microalgae and One Macroalga. J Appl Phycol 1991, 3, 259–264.
- Fabregas, J.; Herrero, C. Vitamin Content of Four Marine Microalgae. Potential Use as Source of Vitamins in Nutrition. Journal of Industrial Microbiology 1990, 5, 259–263.
- Widowati, I.; Zainuri, M.; Kusumaningrum, H.P.; Susilowati, R.; Hardivillier, Y.; Leignel, V.; Bourgougnon, N.; Mouget, J.-L. Antioxidant Activity of Three Microalgae Dunaliella salina, Tetraselmis chuii and Isochrysis galbana Clone Tahiti. IOP Conf. Ser.: Earth Environ. Sci. 2017, 55, 012067.
- Goiris, K.; Muylaert, K.; Fraeye, I.; Foubert, I.; De Brabanter, J.; De Cooman, L. Antioxidant Potential of Microalgae in Relation to Their Phenolic and Carotenoid Content. J Appl Phycol 2012, 24, 1477–1486.
- Banskota, A.H.; Sperker, S.; Stefanova, R.; McGinn, P.J.; O’Leary, S.J.B. Antioxidant Properties and Lipid Composition of Selected Microalgae. J Appl Phycol 2019, 31, 309–318.
- Nadeem, F.; Hanif, M.A.; Majeed, M.I.; Mushtaq, Z. Role of Macronutrients and Micronutrients in the Growth and Development of Plants and Prevention of Deleterious Plant Diseases – A Comprehensive Review. Int J Chem Biochem Sci 2018, 13, 31–52.
- Mulbry, W.; Kondrad, S.; Pizarro, C. Biofertilizers from Algal Treatment of Dairy and Swine Manure Effluents: Characterization of Algal Biomass as a Slow Release Fertilizer. Journal of Vegetable Science 2007, 12, 107–125.
- Davies, P. J. Plant hormones: biosynthesis, signal transduction, action!; Springer: New York, USA, 2004.
- Lu, Y.; Xu, J. Phytohormones in Microalgae: A New Opportunity for Microalgal Biotechnology? Trends in Plant Science 2015, 20, 273–282.
- Tarakhovskaya, E.R.; Maslov, Yu.I.; Shishova, M.F. Phytohormones in Algae. Russ J Plant Physiol 2007, 54, 163–170.
- Gharib, F.A.E.L.; Osama, K.; Sattar, A.M.A.E.; Ahmed, E.Z. Impact of Chlorella vulgaris, Nannochloropsis salina, and Arthrospira platensis as Bio-Stimulants on Common Bean Plant Growth, Yield and Antioxidant Capacity. Sci Rep 2024, 14, 1398.
- Auer, C.A. Cytokinin Conjugation: Recent Advances and Patterns in Plant Evolution. 1997, 23, 17–32.
- Woodward, A.W. Auxin: Regulation, Action, and Interaction. Annals of Botany 2005, 95, 707–735.
- Yamaguchi, S. Gibberellin Metabolism and Its Regulation. Annu. Rev. Plant Biol. 2008, 59, 225–251.
- Finkelstein, R. Abscisic Acid Synthesis and Response. The Arabidopsis Book 2013, 11, e0166.
- D’Mello, J. F. Amino acids in higher plants; CABI International: Edinburgh, UK, 2015.
- Forde, B.G.; Lea, P.J. Glutamate in Plants: Metabolism, Regulation, and Signalling. Journal of Experimental Botany 2007, 58, 2339–2358.
- Lehmann, S.; Funck, D.; Szabados, L.; Rentsch, D. Proline Metabolism and Transport in Plant Development. Amino Acids 2010, 39, 949–962.
- Kawade, K.; Tabeta, H.; Ferjani, A.; Hirai, M.Y. The Roles of Functional Amino Acids in Plant Growth and Development. Plant And Cell Physiology 2023, 64, 1482–1493.
- Rahman, M.; Mostofa, M.G.; Keya, S.S.; Rahman, A.; Das, A.K.; Islam, R.; Abdelrahman, M.; Bhuiyan, S.U.; Naznin, T.; Ansary, M.U.; et al. Acetic Acid Improves Drought Acclimation in Soybean: An Integrative Response of Photosynthesis, Osmoregulation, Mineral Uptake and Antioxidant Defense. Physiologia Plantarum 2021, 172, 334–350.
- Talebi, M.; Hadavi, E.; Jaafari, N. Foliar Sprays of Citric Acid and Malic Acid Modify Growth, Flowering, and Root to Shoot Ratio of Gazania (Gazania rigens L.): A Comparative Analysis by ANOVA and Structural Equations Modeling. Advances in Agriculture 2014, 2014, 1–6.
- Duan, C.; Wu, S.; Sang, Y.; Bahetibieke, W.; Ru, J.; Song, J.; Cui, X. Exogenous Succinic Acid Mediates Responses of Larix olgensis A. Henry to Cadmium Stress. International Journal of Phytoremediation 2019, 21, 742–751.
- Painter, T.J. Algal Polysaccharides. In The Polysaccharides; Elsevier: Amsterdam, The Netherlands, 1983; pp. 195–285.
- Kloareg, B.; Quatrano, R. S. Structure of the cell walls of marine algae and ecophysiological functions of the matrix polysaccharides. Oceanography and Marine Biology: An Annual Review 1988, 26, 259-315.
- Bremauntz, Ma.D.P.; Torres-Bustillos, L.G.; Cañizares-Villanueva, R.-O.; Duran-Paramo, E.; Fernández-Linares, L. Trehalose and Sucrose Osmolytes Accumulated by Algae as Potential Raw Material for Bioethanol. NR 2011, 02, 173–179.
- Salerno, G.L.; Pontis, H.G. Raffinose Synthesis in Chlorella vulgaris Cultures after a Cold Shock. Plant Physiol. 1989, 89, 648–651.
- Jiménez-Arias, D.; García-Machado, F.J.; Morales-Sierra, S.; García-García, A.L.; Herrera, A.J.; Valdés, F.; Luis, J.C.; Borges, A.A. A Beginner’s Guide to Osmoprotection by Biostimulants. Plants 2021, 10, 363.
- Keller, M.D.; Kiene, R.P.; Matrai, P.A.; Bellows, W.K. Production of Glycine Betaine and Dimethylsulfoniopropionate in Marine Phytoplankton. I. Batch Cultures. Marine Biology 1999, 135, 237–248.
- Morais, M.G.; Santos, T.D.; Moraes, L.; Vaz, B.S.; Morais, E.G.; Costa, J.A.V. Exopolysaccharides from Microalgae: Production in a Biorefinery Framework and Potential Applications. Bioresource Technology Reports 2022, 18, 101006.
- Yi, Z.; Su, Y.; Brynjolfsson, S.; Olafsdóttir, K.; Fu, W. Bioactive Polysaccharides and Their Derivatives from Microalgae: Biosynthesis, Applications, and Challenges. In Studies in Natural Products Chemistry; Elsevier: Amsterdam, The Netherlands, 2021; Volume 71, pp. 67–85.
- Moreira, J. B.; Vaz, B. D. S.; Cardias, B. B.; Cruz, C. G.; Almeida, A. C. A. D.; Costa, J. A. V.; Morais, M. G. D. Microalgae polysaccharides: an alternative source for food production and sustainable agriculture. Polysaccharides 2022, 3, 441-457.
- El Arroussi, H.; Benhima, R.; Elbaouchi, A.; Sijilmassi, B.; El Mernissi, N.; Aafsar, A.; Meftah-Kadmiri, I.; Bendaou, N.; Smouni, A. Dunaliella salina Exopolysaccharides: A Promising Biostimulant for Salt Stress Tolerance in Tomato (Solanum lycopersicum). J Appl Phycol 2018, 30, 2929–2941.
- El Arroussi, H.; Elmernissi, N.; Benhima, R.; Kadmiri, I.M.E.; Bendaou, N.; Smouni, A. Microalgae Polysaccharides a Promising Plant Growth Biostimulant. 2016.
- Gitau, M. M.; Farkas, A.; Ördög, V.; Maróti, G. Evaluation of the biostimulant effects of two Chlorophyta microalgae on tomato (Solanum lycopersicum). Journal of Cleaner Production 2022, 364, 132689.
- Ortiz-Tena, J.G.; Rühmann, B.; Schieder, D.; Sieber, V. Revealing the Diversity of Algal Monosaccharides: Fast Carbohydrate Fingerprinting of Microalgae Using Crude Biomass and Showcasing Sugar Distribution in Chlorella vulgaris by Biomass Fractionation. Algal Research 2016, 17, 227–235.
- Raposo, M.; De Morais, R.; Bernardo De Morais, A. Bioactivity and Applications of Sulphated Polysaccharides from Marine Microalgae. Marine Drugs 2013, 11, 233–252.
- Liu, X.; Zhang, M.; Liu, H.; Zhou, A.; Cao, Y.; Liu, X. Preliminary Characterization of the Structure and Immunostimulatory and Anti-Aging Properties of the Polysaccharide Fraction of Haematococcus pluvialis. RSC Adv. 2018, 8, 9243–9252.
- Žunić, V.; Hajnal-Jafari, T.; Stamenov, D.; Djurić, S.; Tomić, J.; Pešaković, M.; Grohar, M.C.; Stampar, F.; Veberic, R.; Hudina, M.; Jakopic, J. Application of microalgae-based biostimulants in sustainable strawberry production. Journal of Applied Phycology 2024, 36(3), 1219-1231.
- Barone, V.; Baglieri, A.; Stevanato, P.; Broccanello, C.; Bertoldo, G.; Bertaggia, M.; Cagnin, M.; Pizzeghello, D.; Moliterni, V.M.C.; Mandolino, G.; Fornasier, F.; Squartini, A.; Nardi, S.; Concheri, G. Root morphological and molecular responses induced by microalgae extracts in sugar beet (Beta vulgaris L.). Journal of Applied Phycology 2018, 30, 1061-1071.