Comparative Sustainability of Rendered Animal Proteins and Plant-based Proteins Used in the Diets of Three Aquaculture Species
Jing Tang1, S. Patricia Batres-Marquez1, David A Miller1, and David L Meeker2*
1Decision Innovation Solutions, 11107 Aurora Avenue, Urbandale, Iowa 50322, USA;
2Fats and Proteins Research Foundation, North American Renders Association, 500 Montgomery St. Suite 310, Alexandria, Virginia 22314, USA
DOI: 10.37722/JAMBE.2026304
Abstract
While increased productivity in aquaculture has contributed to a reduction in greenhouse gas emissions per unit of production, additional reductions may be attained by modifying the ingredients in the feed of Nile tilapia, salmon and shrimp. In this study, a baseline diet for each of these species was formulated from multiple commercial feeds to more closely align with the composition of diets used in the commercial farming of these species. Then, using the same list of feed ingredients, an alternative scenario was defined that balanced the ration for energy, protein and fat nutrient requirements, while simultaneously constraining the inclusion rate of individual feed ingredients to no more than 150% of the baseline diet and minimizing the greenhouse gas emissions. Excel Solver was utilized for scenario optimization, and sensitivity reports were generated to evaluate the robustness of the results. In the alternative scenario diet for all three studied species, based on model assumptions, decreases of 8.4% in plant-based protein meals and 23.9% in grains, and an increase of 36.8% in animal byproduct protein meals were implemented. As a result, total greenhouse gas emissions were estimated to be reduced by 15.3% relative to the baseline diet, and the total acres of land use decreased by 20%.
Keywords: Greenhouse Gas Emission; Life Cycle Assessment; Land Use; Nile tilapia; Salmon; Shrimp; Rendered Animal Protein Meals; Feed Utilization
Introduction
Aquaculture species make important contributions to food composition, providing high levels of proteins and essential nutrients—such as essential fatty acids (omega-3s), vitamins (A, B, and D) and minerals (calcium, phosphorus, zinc, iron, selenium and iodine)—when compared to other food commodities [1]. Over the last decade, aquaculture production has grown in the United States by 13.9%, from 420 thousand tons to 479 thousand tons (live weight) [2], while U.S. per capita consumption of seafood products increased from 16.8 pound per person in 2012 to 20.8 pound per person in 2022 [3]. In the U.S., the annual value of farmed salmon was more than $60 million [4], while that of farmed Nile tilapia exceeded $40 million [5] and farmed shrimp exceeded $12 million [6]. Salmon leads in high-value marine farming, while shrimp consistently ranks as the top seafood consumed in the U.S. Tilapia has grown in popularity due to its versatility and the high-volume affordable fillet market [7]. Nile tilapia, salmon, and shrimp were selected for this study because they represent economically important aquaculture species with distinct nutritional requirements, feeding strategies, and commercial feed formulations. Together, these species provide a useful framework for evaluating whether sustainability benefits associated with alternative protein sources are consistent across different aquaculture production systems.
Feed is commonly used in aquaculture. According to Naylor et al. [8], in 2017, 51.2 million tons of feed were consumed by farmed fish. A 2022 survey reported that 1.27 billion tons of aquaculture feed were produced worldwide [9]. Historically, commercial diets for farmed Nile tilapia, salmon and shrimp in the U.S. have relied significantly on plant-based proteins with relatively high greenhouse gas emission (GHGE) intensity scores. This raises the question of how to formulate commercial diets that meet the nutritional requirements of these species using existing ingredients while minimizing the greenhouse gas footprint. A more holistic approach to aquaculture feed has been advocated by increasing the use and recycling of circular ingredients to reduce the carbon footprint, which is expected to benefit the aquaculture sector from social, economic and environmental aspects [10–12].
Life cycle assessment (LCA) involves the compilation and evaluation of the inputs, outputs and potential environmental impacts of a product system throughout its life cycle. LCA defines the life cycle of a product system as comprising consecutive and interlinked stages, starting from the acquisition of raw materials and extending through material processing, technology manufacturing, construction, technology use/maintenance/upgrade and, finally, technology retirement [13]. LCA also provides a framework for understanding economic and social impacts. When conducting an LCA, data are collected at the unit process level to represent a single industrial activity. In the context of this study, the food and agriculture industry is considered; in particular, the performed LCA holistically estimates the utilization of resources and pollutant emissions during the life cycle of feed ingredients. Each single industrial activity (a) produces products and sometimes co-products; (b) uses resources from the environment; (c) uses resources from other unit processes in the production chain; and (d) generates emissions to the environment [13,14].
Watch the Article in Motion
Authors:

David L Meeker

Jing Tang

S. Patricia Batres-Marquez

David A Miller
An LCA combines unit process data for the life cycle of a product, and the impact assessment estimates the impact associated with its activities and the flows to and from the environment for the inventory. A precise LCA calculates and assigns the GHGE values for different activities in different stages [13,15].
Therefore, it is important to estimate the extent of GHGEs from current commercial aquaculture diets and to identify potential substitutes for existing ingredients that are commonly used in commercial feeds, in order to formulate diets that can lower GHGEs while still meeting the nutritional requirements of aquaculture species. Few studies have discussed this topic [16–19]. The primary objective of this study was to compare the sustainability performance of plant-based protein meals and rendered animal protein meals used in diets for Nile tilapia, salmon, and shrimp. Specifically, the study evaluated differences in greenhouse gas emission intensity, essential amino acid supply, and land-use requirements among major feed ingredients and assessed how diet reformulation could reduce the environmental footprint of aquaculture production while maintaining nutritional adequacy. Hence, this study aimed to investigate how protein feed ingredients, such as plant-based meals, rendered animal protein meals and grain products (i.e., wheat and wheat middlings), which are commonly used in aquaculture diets for Nile tilapia, salmon and shrimp, affect the following:
- GHGE estimates for the production of selected feed ingredients.
- Composition of essential amino acids (EAAs) and the GHGE of each EAAs fractions.
- Availability of EAAs needed for aquaculture rations.
The data were comprehensively analyzed to provide estimates of the environmental footprint associated with the production of specific amounts (per metric ton, MT) of these feed sources.
Data and Methods
The Global Feed LCA Institute (GFLI)’s database provides information on the GHGEs of different feed ingredients [20], including the LCAs of raw materials from various regions in the world. The system boundary from cradle-to-farm gate for cultivated products includes all life cycle stages up to the delivery of the feed to the farm, as well as feed mill operations and logistics, while the system boundary from cradle-to-processing gate for processed products includes the transport of these products to the processing plant and their processing. The GFLI database contains three types of allocations: economic allocation, dry matter, and energy content. Allocations are important for products with substantial inputs from other product systems and substantial outputs to other product systems [21]. The database supports the environmental assessment of animal nutrition products. Data obtained from economic allocation (EA) was selected for this analysis. EA is a method to measure the economic value of the main product and its co-products. The European Union’s Product Environmental Footprint (PEF) guidelines [22] indicate that economic allocation is the preferred allocation. With this method, the environmental impacts of a production process are accurately reflected in its outputs. The GFLI database was used to establish the GHGEs for the selected feedstuffs, with the factors converted to values per metric ton.
A wide-ranging literature and database review was carried out to determine the GHGE intensities associated with the production of selected animal-based and plant-based feed ingredients. GHGEs associated with the production of feed ingredients can be influenced by many factors, such as feed type (crops and their co-products versus animal species and their byproducts), genetic differences, cultivation practices, harvest and post-harvest conditions, processing, overall technology, production systems and location. The GFLI database was the main source of data for this study, and information contained in several reports was also included to supplement the data. The GHGE intensities associated with the production of feed ingredients used in the aquaculture industry and included in this study are presented in Appendix Table A4.
From a feed consumption standpoint, Feed Tables [23] and Feedipedia [24] were related data sources used to estimate aquaculture feed consumption. Data from the USDA National Animal Nutrition Program (NANP) [25] were used to obtain the feed ingredients’ nutritional profiles. The USDA NASS and USDA Census databases were used to estimate the studied aquaculture species (Nile tilapia, salmon and shrimp) production statistics. Data from other relevant publications [26–31] were also included. This study took into consideration several factors potentially limiting the amount of a particular byproduct feed in rations, including palatability, moisture content of the total diet, energy content, protein balance, carbohydrate balance, fiber levels, and fat concentrations.
From the relevant databases, data summaries were created for the total production of crops that are important for the feeding and production of the three studied aquaculture species in the U.S., the total land use footprint and the GHGE footprint for each crop and fraction.
To gain a better understanding of the commercial aquaculture diets for the studied species, and due to confidentiality agreements with the providers of these commercial diets, a more representative baseline diet for each species was formulated, composed of at least four commercial diets (Nile tilapia: 4 commercial diets; salmon: 5 commercial diets; shrimp: 10 commercial diets). The major protein ingredients were defined as those ingredients that are protein resources to the studied species, and an inclusion rate of the ingredient was greater than 1%, defined as major feed ingredients. For each species, all the selected feed ingredients were broken out from the commercial diets, then the average of these ingredients was calculated to create the baseline diet. Note that feed additives—such as minerals, vitamins, antioxidants, cholesterol and BHT—were aggregated and identified as “feed additives” and were not estimated individually.
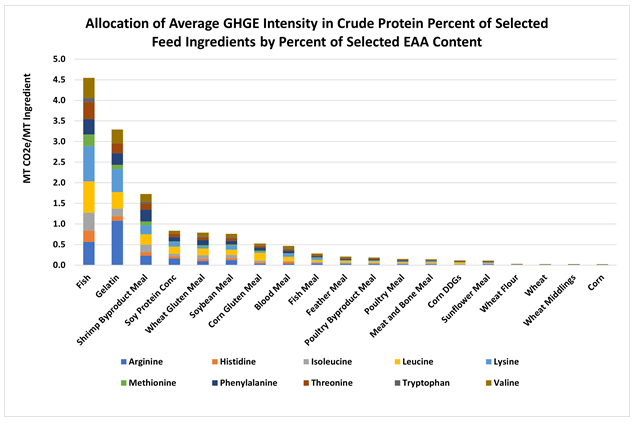
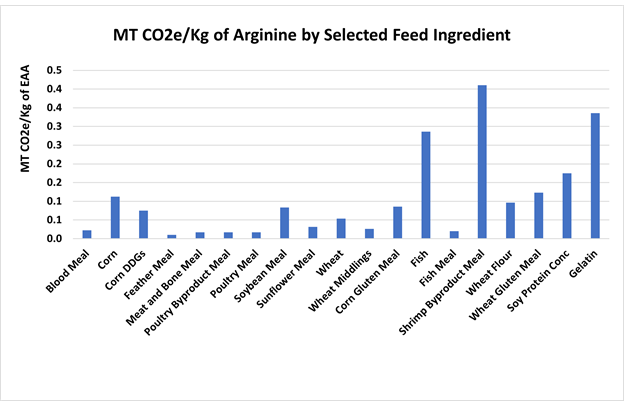
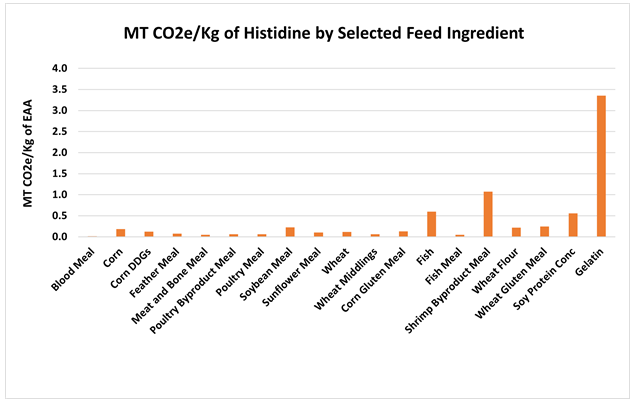
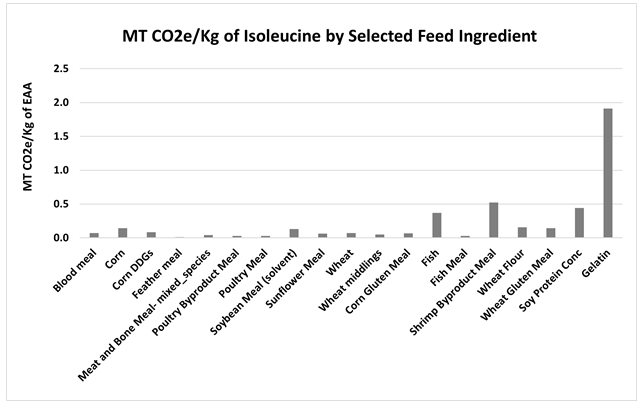
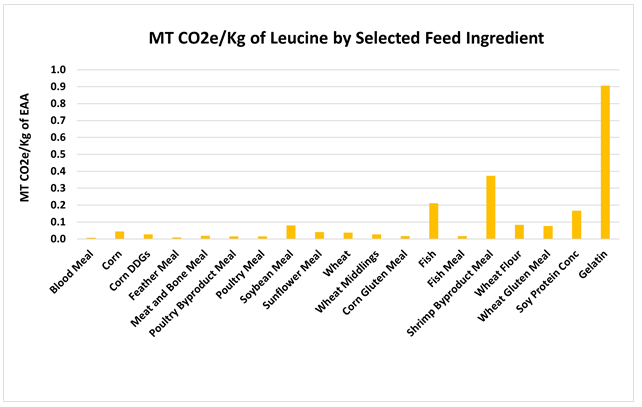
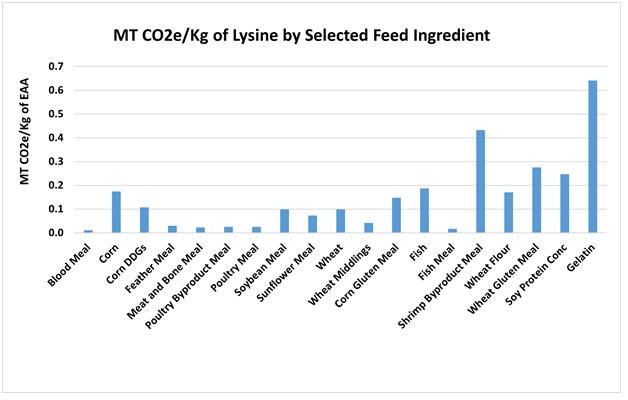
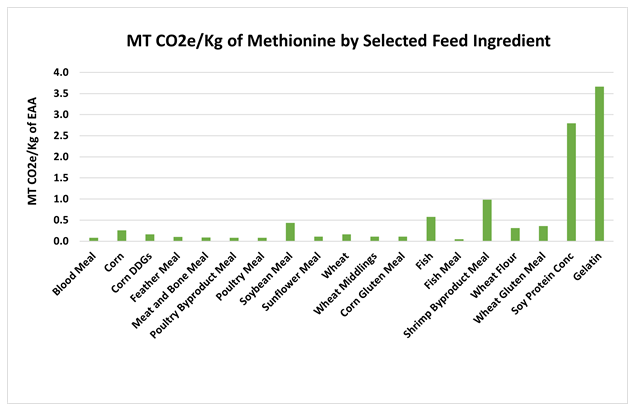
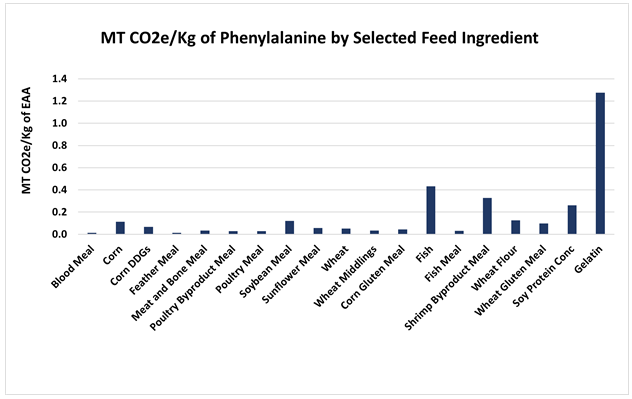
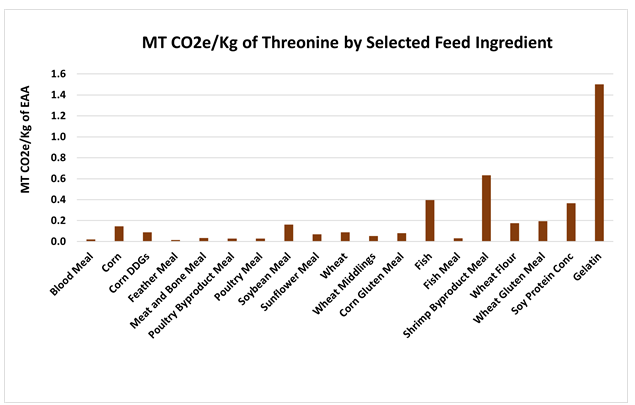
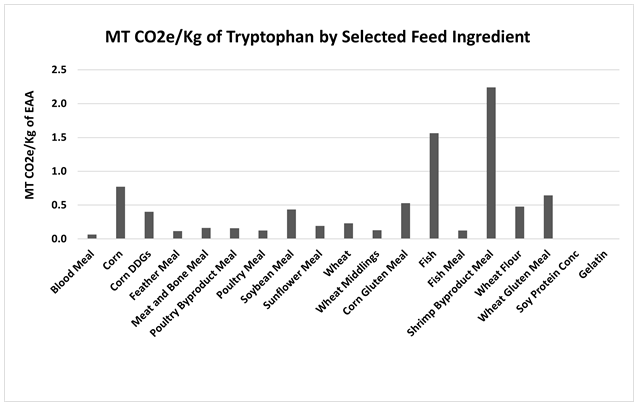
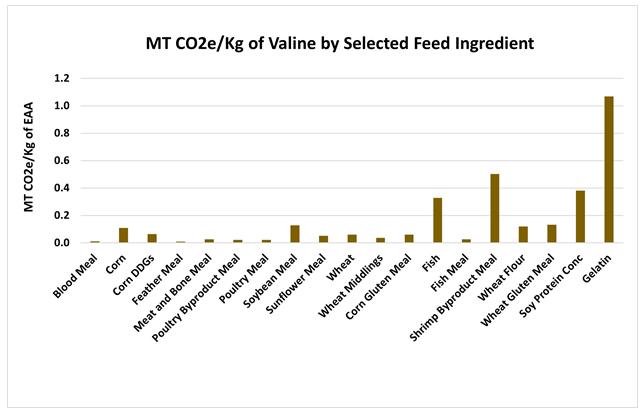
A baseline diet was created for each species. The GHGEs for EAAs in a given ingredient was calculated as follows: feed consumption × the crude protein (CP) content × the EAA coefficient (percentage of CP) × the corresponding apparent digestibility (AD) × the corresponding GHGE coefficient of a protein feed ingredient. The AD of the CP content for each ingredient is shown in Appendix Table A5, and the allocation of the average GHGEs for the CP content of selected feed ingredients based on the percentage of EAA content is shown in Appendix Figure A1. Additionally, Appendix Figure A2 to Figure A11 show the metric tons of GHGEs per Kg of selected EAAs in the major plant and animal protein meal ingredients.
Total land used (number of acres) to produce the corresponding quantity of each ingredient (in MT) was estimated by aggregating the values for all ingredients for each studied species. The land use required to produce each individual ingredient was calculated as follows: land use conversion factor times tonnage of ingredient usage. The land use conversion factor (m2a crop eq /MT ingredient) by ingredient was obtained from the GFLI [20], and the factor’s unit was converted to Acres/MT ingredient by dividing by 4046.86.
The same list of feed ingredients was used in an alternative scenario, in which the EAA needs of the three studied aquaculture species were assumed to be met using more rendered animal-based EAAs while minimizing the GHGEs of aquaculture production, subject to other considerations such as the limit placed on any particular feedstuff’s inclusion in a ration due to energy content, protein balance, fiber levels and fat concentrations. In this way, the ration was balanced in terms of energy, protein and fat requirements, ensuring the amino acid fractions are met on a digestibility basis while minimizing the GHGEs from feed ingredients. Adding an excessive amount of a certain ingredient into the diet could cause anti-nutrition issues, such as mineral antagonism, EAA gaps, poor palatability and, sometimes, lower pellet stability. Moreover, the availability of most rendered animal products is limited by meat production. To make the alternative diet scenario realistic, the feed ingredients were capped at 150% of the baseline diet for a given ingredient for Nile tilapia and salmon, and at 125% of the baseline diet for shrimp. Then, following the same steps used in the baseline analysis, the GHGEs of the selected ingredients and the EAA fractions of these ingredients were determined for each species.
To make the baseline and alternative diets comparable, the nutrient requirements of each species were estimated according to the averaged values of the commercial diets, as detailed in Table 1. And the corresponding nutritional composition of the studied protein ingredients is shown in Appendix Table A6 and Table A7.
Table 1. Nutrient requirements by species. *
| Species | Crude Protein (g/100g of diet) | Fat (g/100g of diet) | Fiber (g/100g of diet) | Moisture (g/100g of diet) |
| Nile Tilapia | 33.8 | 7.9 | 3.7 | 11.5 |
| Salmon | 32.9 | 24.1 | 2.9 | 9.0 |
| Shrimp | 34.7 | 8.5 | 2.3 | 10.0 |
* These nutrient requirements, estimated from specific commercial diets, may not necessarily be the same as those indicated in the Nutrient Requirements of Fish and Shrimp published by the National Research Council.
The diets for the alternative scenario were determined using the add-in program “Solver” in Excel. The solving method was set to “Simplex LP”; Integer Optimality (%) was set to 1; Iterations was set to 100; and Constraint Precision was set to 0.000001. A sensitivity report was simultaneously generated by Solver when it solved for the optimization solution.
Of note, a feed ingredient was only used in a ration if it was found in the baseline ration for a given species. For instance, “poultry meal” was only used in the baseline salmon diet; therefore, under the alternative scenario, poultry meal was only used in the diet for salmon and not in the diets for Nile tilapia and shrimp. Additionally, the feed additives were not considered in the diets of the alternative scenario, as their inclusion was beyond the scope of the study.
Results
For all three aquaculture species studied, the analyses included a baseline diet and an alternative scenario diet.
Nile Tilapia
Information on the four commercial feeds for Nile tilapia was provided by the feed suppliers. The averages of the ingredients in these feeds were calculated to create the base-line diet and the alternative scenario diet, and the corresponding GHGE intensity scores are shown in Table 2. Grains comprised 27% of the baseline diet and accounted for 6.7% of the GHGEs. Animal protein meals comprised 20.1% of the baseline diet and accounted for 21.7% of the GHGEs. Plant-based protein meals comprised 39.4% of the baseline diet and accounted for 71.6% of the GHGEs. In the GHGE-minimizing diet under the alternative scenario, grains comprised 17.8% of the diet and accounted for 3.9% of the GHGEs, animal proteins comprised 30.6% of the diet and accounted for 20.5% of the GHGEs, and plant-based proteins comprised 40.4% of the diet and accounted for 75.6% of the GHGEs. An interesting finding is that although the total GHGEs from soybean meal dropped by more than 3,000 MT, the percentage of GHGEs attributed to soybean meal was nearly un-changed, being 65% in the baseline diet and 64.9% in the alternative scenario diet, as the total GHGE in the scenario diet was 4,5234 MT less than the baseline diet.
Table 2. Inclusion rate (%) of each feed ingredient and corresponding GHGE intensity for Nile tilapia by scenario.
| Feed Ingredient | Inclusion Rate (%) Baseline Diet | GHGEs (MT CO2e) Baseline Diet | Inclusion Rate (%) Alternative Scenario Diet | GHGEs (MT CO2e) Alternative Scenario Diet |
| Soybean Meal | 32.4 | 37,615.0 | 29.8 | 34,614.7 |
| Poultry Byproduct Meal | 13.8 | 3,613.3 | 20.6 | 5,419.9 |
| Wheat | 11.9 | 1,811.6 | 3.9 | 591.1 |
| Wheat Middlings | 9.3 | 1,003.9 | 13.9 | 1,505.9 |
| Corn | 6.3 | 1,075.3 | 0 | 0 |
| Corn Gluten Meal | 4.5 | 2,928.6 | 6.8 | 4,392.9 |
| Fish Meal1 | 3.6 | 1,180.1 | 5.4 | 1,770.2 |
| Meat and Bone Meal | 2.7 | 654.1 | 4.0 | 981.2 |
| Corn DDGs | 2.5 | 861.0 | 3.8 | 1,291.5 |
| Shrimp Byproduct Meal | 1.5 | 5,266.5 | 0 | 0 |
| Soybean Oil | 1.3 | — 3 | 1.3 | — |
| DL Methionine | 0.5 | — | 0.5 | — |
| Fish2 | 0.4 | 1,837.3 | 0.6 | 2,756.0 |
| Fish Oil | 0.3 | — | 0.3 | — |
| Rice | 0.3 | — | 0.3 | — |
| Lecithin | 0.3 | — | 0.3 | — |
| Feed Additives | 8.7 | — | 8.7 | — |
| Total | 100.0 | 57,846.7 | 100.0 | 53,323.3 |
1 “Fish Meal” ingredient refers to rendered fish meal and applies to all reference to “fish meal” in this study. 2 “Fish” ingredient refers to general marine fish and applies to all references to “fish” in this study. 3 Dash means a corresponding ingredient was not selected as an ingredient in this study.
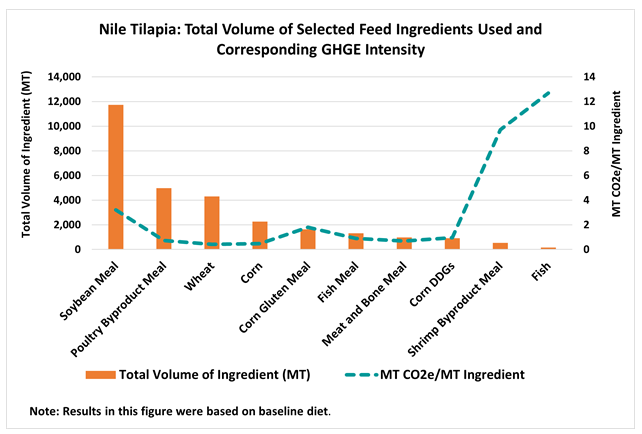
Figure 1 shows the total volume of each selected feed ingredient used in Nile tilapia production in the U.S. based on the baseline estimates and the corresponding GHGE in-tensities of those ingredients. By far, soybean meal was the ingredient with the largest volume, with approximately 12,000 MT used in the Nile tilapia baseline diet. The GHGE intensity of soybean meal was estimated to be 3.2 MT CO2e/MT [20]. Poultry byproduct meal was in second place, in terms of volume used in Nile tilapia production (4,977 MT) in 2022.
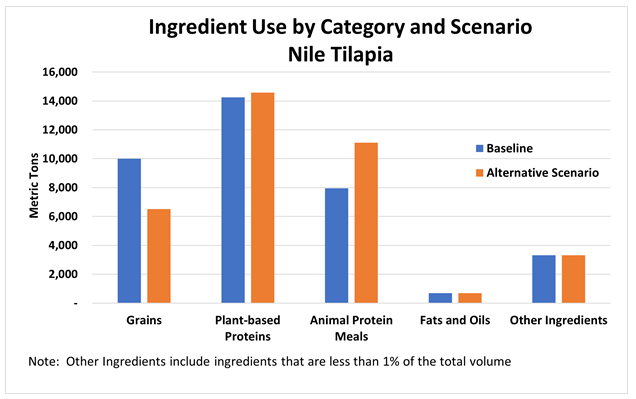
For Nile tilapia, GHGEs could be minimized by reducing grains in the diet by 35% (-3.5 thousand MT), increasing plant-based proteins by 2.1% (0.3 thousand MT), and increasing rendered animal-based proteins by 40.5% (3.2 thousand MT), with no changes required for the contents of fats and oils or other ingredients, as shown in Figure 2.
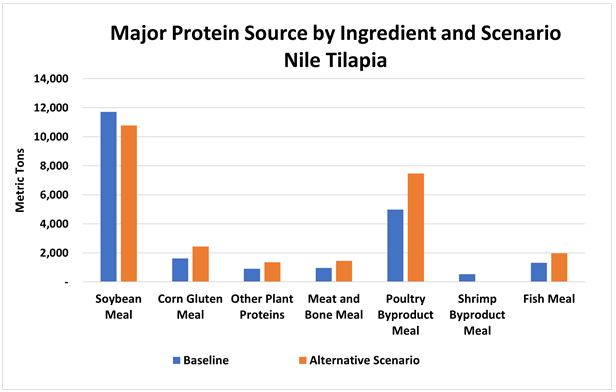
Meeting the nutritional needs of Nile tilapia while minimizing GHGEs required a change in the mix of major protein meal sources used in the diet (Figure 3). This included decreasing shrimp byproduct meal in the diet by 100% and soybean meal by 7.7%, while increasing corn gluten meal, other plant proteins, meat and bone meal, and poultry byproduct meal by 50%, which hit the maximum inclusion cap.
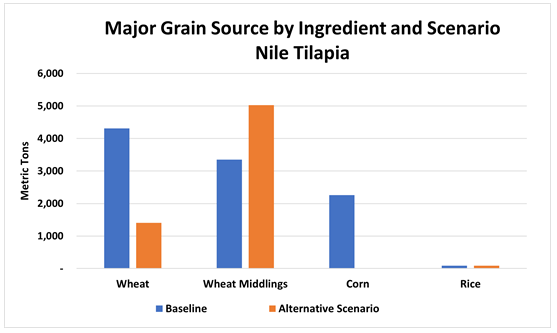
Similarly to major protein sources, minimizing GHGEs required a significant change in the mix of major grain sources used in Nile tilapia diets (Figure 4). This included a 100% decrease in the content of corn and a decrease of 67% in the content of wheat in the diet, along with a 50% increase in wheat middlings but no change in the inclusion rate of rice. Nile tilapia is the only species in which GHGEs could be reduced by changing the composition of grains in the diet; on the other hand, for salmon and shrimp, a change in protein sources is needed to reduce GHGEs.
The feed ingredients usage for both the baseline and alternative scenario diets for Nile tilapia are shown in Appendix Table A1. The GHGEs for selected feed ingredients by scenario are shown in Appendix Table A2, and the GHGEs by EAA for each scenario are shown in Appendix Table A3.
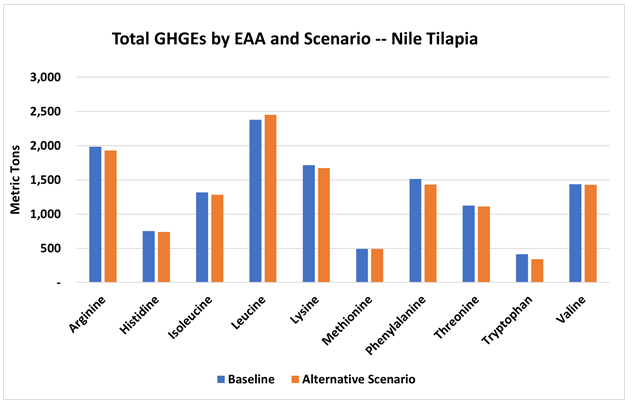
The total GHGEs by EAA and scenario for Nile tilapia are shown in Figure 5. For Arginine, GHGEs decreased by 2.8% for the alternative scenario diet compared to the baseline diet. The percentage changes in GHGEs for other EAAs under the alternative scenario diet were as follows: Histidine by -2.1%, Isoleucine by -2.5%, Leucine by +3.0%, Lysine by -2.6%, Methionine by -0.2%, Phenylalanine by -5.6%, Threonine by -1.0%, Tryptophan by -18.1% and Valine by -0.5%. The data is also shown in Table 8.
A sensitivity report for the Nile tilapia alternative scenario diet is shown in Table 3. The ingredients were sorted by their inclusion rate in the diet, with soybean meal (29.8%) and poultry byproduct meal (20.6%) in the lead. The inclusion rates of other ingredients, including “Rice” to “Feed Additives”, remained the same as in the baseline diet. The robustness index was calculated as “Allowable Increase” divided by “GHGEs”, which means that within a certain percentage change of GHGEs for a given ingredient, the corresponding inclusion rate remains the same as the current inclusion rate shown in the “Final Value” column; for example, the top three protein ingredients ranked by their robustness were soybean meal, fish meal and poultry byproduct meal, with values of 383.8%, 294.8% and 273.8%, respectively. Therefore, if the GHGE value of soybean meal increased within 383.3% of its current GHGE value (0.0321), the 29.8% inclusion rate would remain the same. Based on the model estimates, soybean meal, poultry byproduct meal, fish meal, and meat and bone meal exhibited exceptional stability, indicating that the corresponding GHGE values would need to more than double before a shift in the optimal ingredient mix was required. This sensitivity analysis demonstrates the high robustness of this formulation against potential uncertainties in LCA data.
The ingredients listed in Table 3 with an asterisk are ingredients that hit the 150% maximum inclusion cap. The negative reduced costs —for instance, for poultry byproduct meal (-0.0199) and fish meal (-0.0265)—indicated that, while further GHGE reductions were mathematically possible, the current formulation prioritized nutrient balance over absolute GHGE minimization.
Table 3. Sensitivity and robustness analysis of the alternative scenario diet for Nile tilapia.
| Feed Ingredient | Final Value 1 (%) | Reduced Cost | GHGEs (MT CO2e/MT Ingredient) | Allowable Increase (MT CO2e/MT Ingredient) | Robustness Index 2 (%) |
| Soybean Meal | 29.8 | 0.0000 | 0.0321 | 0.1232 | 383.8% |
| Poultry Byproduct Meal * | 20.6 | -0.0199 | 0.0073 | 0.0199 | 273.8% |
| Wheat Middlings * | 13.9 | -0.0020 | 0.0030 | 0.0020 | 66.4% |
| Corn Gluten Meal * | 6.8 | -0.0160 | 0.0180 | 0.0160 | 89.1% |
| Fish Meal * | 5.4 | -0.0265 | 0.0090 | 0.0265 | 294.8% |
| Meat and Bone Meal * | 4.0 | -0.0083 | 0.0068 | 0.0083 | 122.6% |
| Wheat | 3.9 | 0.0000 | 0.0042 | 0.0009 | 20.6% |
| Corn DDGs * | 3.8 | -0.0030 | 0.0095 | 0.0030 | 31.2% |
| Fish 3,* | 0.6 | -0.0075 | 0.1269 | 0.0075 | 5.9% |
| Shrimp Byproduct Meal | 0 | 0.0757 | 0.0970 | — 6 | NA 7 |
| Corn | 0 | 0.0009 | 0.0048 | — | NA |
| Rice | 0.3 | 0.0011 | NA 5 | — | NA |
| DL Methionine | 0.5 | 0.0011 | NA | — | NA |
| Fish Oil | 0.3 | 0.0011 | NA | — | NA |
| Lecithin | 0.3 | 0.0011 | NA | — | NA |
| Soybean Oil | 1.3 | 0.0011 | NA | — | NA |
| Feed Additives 4 | 8.7 | 0.0011 | NA | — | NA |
1 “Final Value” represents the inclusion rate of an ingredient in the alternative scenario diet. 2 “Robustness Index” is calculated as “Allowable Increase” divided by “GHGEs”. 3 “Fish” ingredient refers to general marine fish. 4 “Feed Additives” refer to an aggregation of all the relevant additives for Nile tilapia from the commercial diets. 5 “NA” under the GHGE column indicates that a corresponding ingredient was not considered in this study but is present in the commercial diets. 6 Dash represents “1E+30” from the sensitivity report generated by Excel Solver. 7 Data is not applicable because the allowable increase is equal to infinity. * Ingredient has hit the 150% cap.
Salmon
Five commercial salmon feeds were provided by feed suppliers. The averages of the ingredients used in these feeds were calculated to create the baseline diet and alternative scenario diet, and the corresponding GHGE intensity scores are shown in Table 4. Grains comprised 16.4% of the baseline diet and accounted for 6.4% of the GHGEs. Animal protein meals comprised 29% of the baseline diet and accounted for 21.0% of the GHGEs. Plant-based proteins comprised 25.1% of the baseline diet and accounted for 72.6% of the GHGEs. In the GHGE-minimizing diet under the alternative scenario, grains comprised 24.6% of the diet and accounted for 15.2% of the GHGEs, animal proteins comprised 38.2% of the diet and accounted for 59.8% of the GHGEs, and plant-based proteins comprised 7.7% of the diet and accounted for 25.0% of the GHGEs.
Table 4. Inclusion rate (%) of each feed ingredient and corresponding GHGE intensity for salmon by scenario.
| Feed Ingredient | Inclusion Rate (%) Baseline Diet | GHGEs (MT CO2e) Baseline Diet | Inclusion Rate (%) Alternative Scenario Diet | GHGEs (MT CO2e) Alternative Scenario Diet |
| Soybean Oil | 11.9 | — 1 | 11.9 | — |
| Poultry Byproduct Meal | 11.8 | 688.3 | 17.7 | 1,032.4 |
| Fish Meal | 9.8 | 708.4 | 14.7 | 1,062.6 |
| Wheat Middlings | 9.2 | 221.1 | 13.8 | 331.6 |
| Soy Protein Conc | 8.8 | 3,771.9 | 0 | 0 |
| Corn Gluten Meal | 7.5 | 1,083.5 | 2.0 | 679.8 |
| Fish Oil | 6.5 | — | 6.5 | — |
| Sunflower Meal | 4.6 | 302.2 | 5.7 | 377.4 |
| Wheat Flour | 4.2 | 225.1 | 6.3 | 213.4 |
| Poultry Meal | 4.0 | 210.1 | 0.8 | 136.6 |
| Soybean Meal | 4.0 | 1,031.9 | 0 | 0 |
| Wheat | 3.0 | 101.4 | 4.5 | 97.6 |
| Lecithin | 2.3 | — | 2.3 | — |
| Blood Meal | 1.8 | 126.9 | 2.6 | 183.8 |
| Poultry Fat | 1.7 | — | 1.7 | — |
| Lysine | 1.6 | — | 1.6 | — |
| Feather Meal | 1.6 | 75.8 | 2.4 | 113.7 |
| DL Methionine | 0.5 | — | 0.5 | — |
| Wheat Gluten Meal | 0.2 | 56.9 | 0 | 0 |
| Histidine | 0.2 | — | 0.2 | — |
| Threonine | 0.1 | — | 0.1 | — |
| Feed Additives | 4.9 | — | 4.9 | — |
| Total | 100.0 | 8,603.4 | 100.0 | 4,228.9 |
1 Dash means that a corresponding ingredient was not selected in this study.
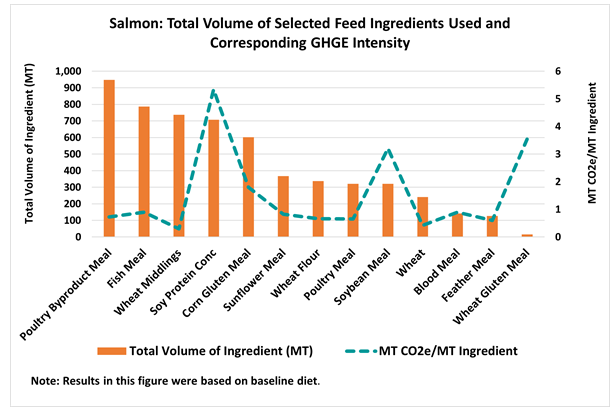
Figure 6 shows the total volume of each selected feed ingredient used in the salmon baseline diet. The largest volume used corresponded to poultry byproduct meal, at 948.0 MT, followed by fish meal (787.6 MT). The GHGE intensity of poultry byproduct meal was estimated to be 0.7 MT CO2e/MT.
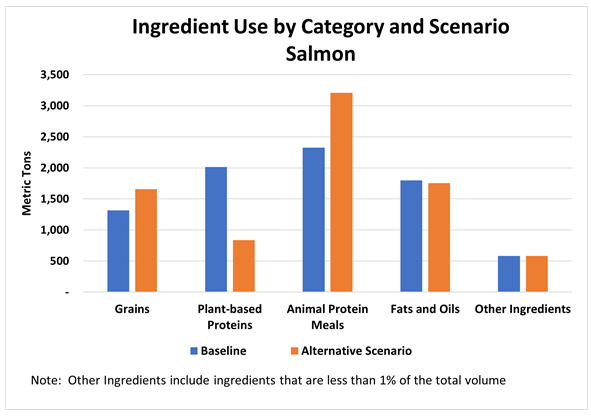
For salmon, GHGEs could be minimized by increasing grains in the diet by 24.9%, decreasing plant-based proteins by 44.1%, and increasing animal proteins by 22.7%, with no change required for the contents of fats and oils or other ingredients, as shown in Figure 7.
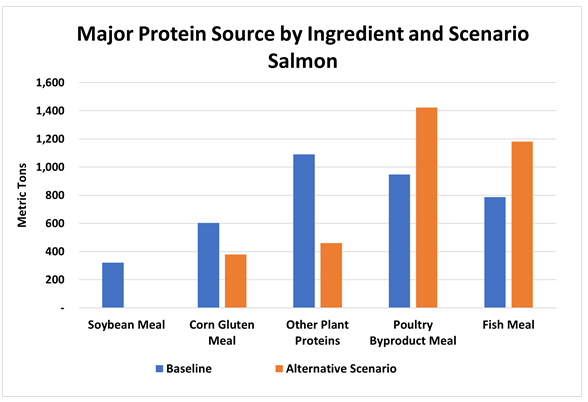
Meeting the nutritional needs of salmon while minimizing GHGEs required a significant change in the mix of major protein meal sources used (as shown in Figure 8). In the GHGE-minimizing scenario, this included decreasing soybean meal by 100% in the diet of salmon, corn gluten meal by 37.3% and other plant-based proteins by 57.8%, while increasing both poultry byproduct meal and fish meal by 50%, which hit the maximum inclusion cap.
In the alternative scenario aimed at minimizing GHGEs for salmon, there were also changes in the mix of grains in the diet, as shown in Figure 9. The content of wheat middlings included in the alternative scenario diet increased by 50%, while the content of wheat decreased by 3.1% and wheat flour decreased by 5.2%. Corn and rice were not included in either diet.
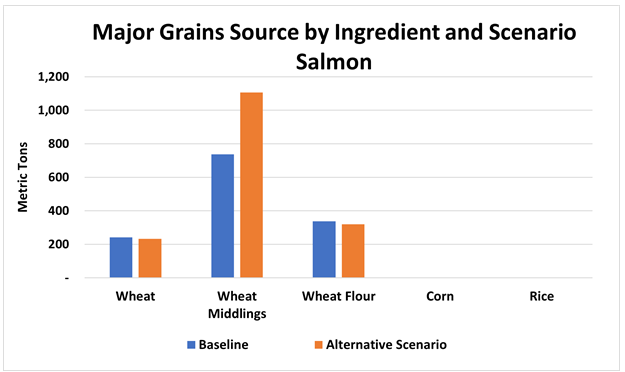
The feed ingredients usage for both the baseline and alternative scenario diets for salmon is shown in Appendix Table A1. The GHGEs for selected feed ingredients by scenario are shown in Appendix Table A2, and the GHGEs by EAA for each scenario are shown in Appendix Table A3.
The total GHGEs by EAA and scenario for salmon are shown in Figure 10. For Arginine, GHGEs decreased by 48.0% for the alternative scenario diet compared to the baseline diet. The percentage changes in GHGEs for other EAAs for the alternative scenario diet were as follows: Histidine by -42.1%, Isoleucine by -39.6%, Leucine by -42.5%, Lysine by -41.5%, Methionine by -18.2%, Phenylalanine by -46.6%, Threonine by -39.8%, Tryptophan by -72.8% and Valine by -31.9%. The data is also shown in Table 8.
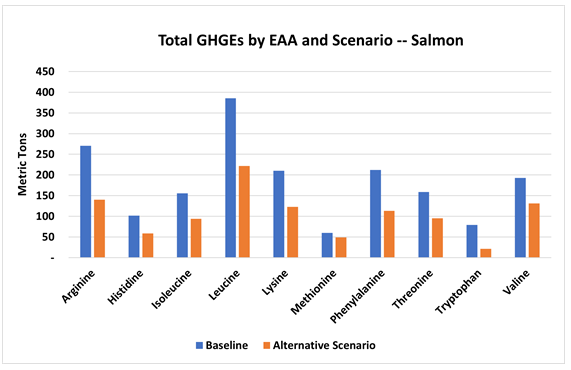
A sensitivity report for the salmon alternative scenario diet is shown in Table 5. The ingredients were sorted by their inclusion rate, with poultry byproduct meal (17.7%) and fish meal (14.7%) in the lead. The inclusion rates of other ingredients, listed from “DL Methionine” to “Feed Additives”, remained the same as in the baseline diet. Based on the robustness index, the top three protein ingredients were feather meal, corn gluten meal and poultry meal, with values of 162.0%, 161.4% and 111.3%, respectively. Therefore, if the GHGE value of feather meal increased within 162.0% of its current GHGE value (0.0060), the 2.4% inclusion rate would remain the same. Based on the model estimates, feather meal, wheat middlings, corn gluten meal, poultry meal, wheat and poultry byproduct meal exhibited good stability, indicating that the corresponding GHGE values would need to increase by more than 1.5 times before a shift in the optimal ingredient mix was required.
The ingredients listed in Table 5 with an asterisk are ingredients that hit the 150% maximum inclusion cap. The negative reduced costs, for instance, for poultry byproduct meal (-0.0052) and fish meal (-0.0051), indicated that while further GHGE reductions were mathematically possible, the current formulation prioritized nutrient balance over absolute GHGE minimization.
Table 5. Sensitivity and robustness analysis of the alternative scenario diet for salmon.
| Feed Ingredient | Final Value 1 (%) | Reduced Cost | GHGEs (MT CO2e/MT Ingredient) | Allowable Increase (MT CO2e/MT Ingredient) | Robustness Index 2 (%) |
| Poultry Byproduct Meal * | 17.7 | -0.0052 | 0.0073 | 0.0052 | 71.8% |
| Fish Meal * | 14.7 | -0.0051 | 0.0090 | 0.0051 | 57.1% |
| Wheat Middlings * | 13.8 | -0.0048 | 0.0030 | 0.0048 | 161.4% |
| Wheat Flour * | 6.3 | -0.0003 | 0.0067 | 0.0003 | 3.9% |
| Sunflower Meal | 5.7 | 0.0000 | 0.0082 | 0.0022 | 27.0% |
| Wheat * | 4.5 | -0.0037 | 0.0042 | 0.0037 | 88.8% |
| Blood Meal * | 2.6 | -0.0032 | 0.0090 | 0.0032 | 36.2% |
| Feather Meal * | 2.4 | -0.0097 | 0.0060 | 0.0097 | 162.0% |
| Corn Gluten Meal | 2.0 | 0.0000 | 0.0180 | 0.0200 | 111.3% |
| Poultry Meal | 0.8 | 0.0000 | 0.0065 | 0.0065 | 98.8% |
| Wheat Gluten Meal | 0.0 | 0.0185 | 0.0354 | — 5 | NA 6 |
| Soy Protein Conc | 0.0 | 0.0419 | 0.0534 | — | NA |
| Soybean Meal | 0.0 | 0.0183 | 0.0321 | — | NA |
| DL methionine | 0.5 | -0.0066 | NA4 | — | NA |
| Lysine | 1.6 | -0.0066 | NA | — | NA |
| Threonine | 0.1 | -0.0066 | NA | — | NA |
| Histidine | 0.2 | -0.0066 | NA | — | NA |
| Soybean Oil | 11.9 | -0.0066 | NA | — | NA |
| Poultry Fat | 1.7 | -0.0066 | NA | — | NA |
| Fish oil | 6.5 | -0.0066 | NA | — | NA |
| Lecithin | 2.3 | -0.0066 | NA | — | NA |
| Feed Additives 3 | 4.9 | -0.0066 | NA | — | NA |
1 “Final Value” represents the inclusion rate of a corresponding ingredient in the alternative scenario diet. 2 “Robustness Index” is calculated as “Allowable Increase” divided by “GHGEs”. 3 “Feed Additives” refer to an aggregation of all the relevant additives from the commercial diets for salmon. 4 “NA” under the GHGE column indicates a corresponding ingredient was not considered in this study but is present in the commercial diets. 5 Dash represents “1E+30” from the sensitivity report generated by Excel Solver. 6 Data is not applicable because the allowable increase is equal to infinite. * Ingredient has hit the 150% cap.
Shrimp
Information on the 10 commercial feeds for shrimp was provided by the feed suppliers. The averages of these ingredients were calculated to create the baseline diet and the alternative scenario diet, and the corresponding GHGE intensity scores are shown in Table 6. Grains comprised 17.3% of the baseline diet and accounted for 5.2% of the GHGEs. Animal proteins comprised 41.0% of the baseline diet and accounted for 29.5% of the GHGEs. Plant-based proteins comprised 31.1% of the baseline diet and accounted for 65.3% of the GHGEs. In the alternative scenario diet, grains comprised 21.6% of the diet and accounted for 9.7% of the GHGEs, animal proteins comprised 17.4% of the diet and accounted for 39.3% of the GHGEs, and plant-based proteins comprised 17.4% of the diet and accounted for 50.9% of the GHGEs.
Table 6. Inclusion rate (%) of each feed ingredient and corresponding GHGE intensity for shrimp by scenario.
| Feed Ingredient | Inclusion Rate (%) Baseline Diet | GHGEs (MT CO2e) Baseline Diet | Inclusion Rate (%) Alternative Scenario Diet | GHGEs (MT CO2e) Alternative Scenario Diet |
| Soybean Meal | 23.0 | 3,427.4 | 13.5 | 2,014.3 |
| Poultry Byproduct Meal | 20.5 | 689.3 | 25.6 | 861.6 |
| Fish Meal | 12.9 | 538.6 | 16.1 | 673.3 |
| Wheat | 8.8 | 171.6 | 11.0 | 214.5 |
| Corn | 8.5 | 186.5 | 10.6 | 233.1 |
| Meat and Bone Meal | 6.9 | 217.0 | 8.6 | 271.3 |
| Wheat Gluten Meal | 5.0 | 821.2 | 0 | 0 |
| Corn starch | 4.2 | — 1 | 4.2 | — |
| Corn Gluten Meal | 3.1 | 259.7 | 3.9 | 324.6 |
| Fish Oil | 1.6 | — | 1.6 | — |
| Soybean Oil | 1.0 | — | 1.0 | — |
| Lecithin | 0.9 | — | 0.9 | — |
| Gelatin | 0.7 | 588.0 | 0 | 0 |
| Inedible Tallow | 0.2 | — | 0.2 | — |
| Feed Additives | 2.8 | — | 2.8 | — |
| Total | 100.0 | 6,899.3 | 100.0 | 4,592.6 |
1 Dash means that a corresponding ingredient was not selected in this study.
Figure 11 shows the total volume of each selected feed ingredient used in the shrimp baseline diet in U.S. production. Soybean meal was the ingredient with the largest volume used in the diet, with an estimated tonnage of 1,067.8 MT. Poultry byproduct meal, at 949.4 MT, was in second place in terms of volume used in the shrimp baseline diet in 2022.
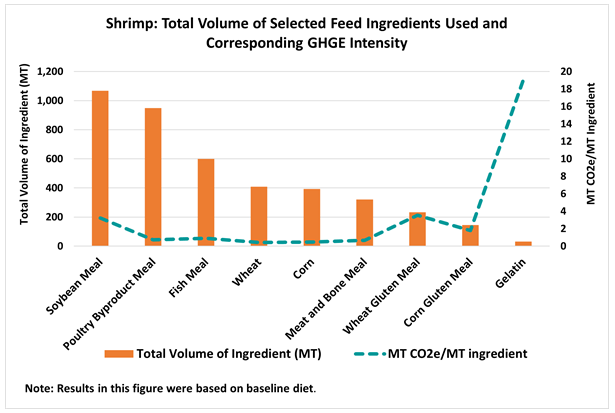
For shrimp, in the GHGE-minimizing scenario, grains in the diet increased by 24.9%, plant-based proteins decreased by 44.1%, and animal proteins increased by 22.7%, with no change in the contents of fats and oils or other ingredients, as shown in Figure 12.
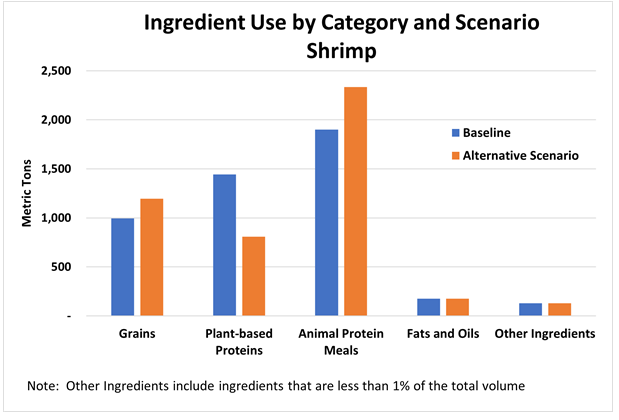
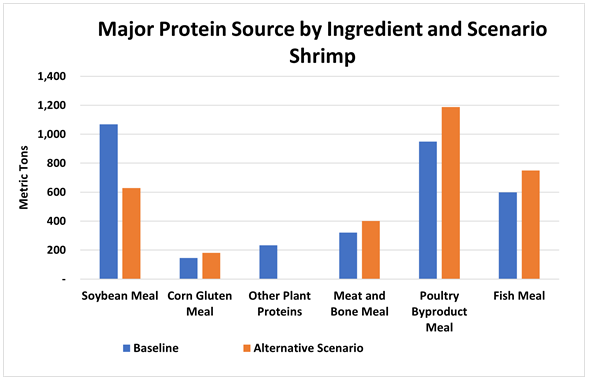
Meeting the nutritional needs of shrimp while minimizing GHGEs required significant change in the mix of major protein meal sources used in the diet (as shown in Figure 13). This included decreasing soybean meal by 41.2%, increasing corn gluten meal by 25.0%, decreasing other plant-based meals by 100%, increasing animal proteins with meat and bone meal by 25%, increasing poultry byproduct meal by 25%, and increasing fish meal by 25%, which hit the maximum inclusion cap.\
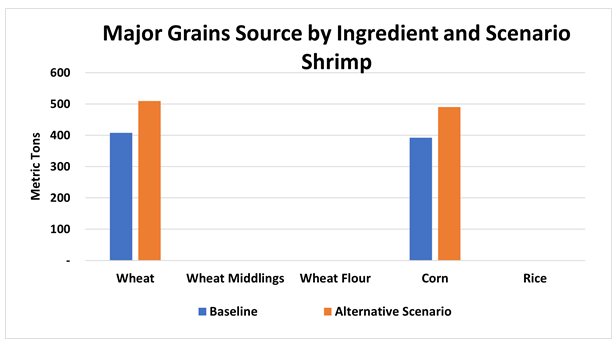
Similarly to major protein sources, minimizing GHGEs required a significant change in the mix of major grain sources used in the shrimp diet (Figure 14). Wheat and corn were included in the baseline shrimp diet at 407.9 MT and 392.3 MT, respectively. In the alternative scenario aimed at minimizing GHGEs, 509.9 MT of wheat and 490.4 MT of corn were included in the shrimp diet, with the contents of both ingredients increasing by 25.0%.
The feed ingredients usage for both the baseline and alternative scenario diets for shrimp are shown in Appendix Table A1. The GHGEs for selected feed ingredients by scenario are shown in Appendix Table A2, and the GHGEs by EAA for each scenario are shown in Appendix Table A3.
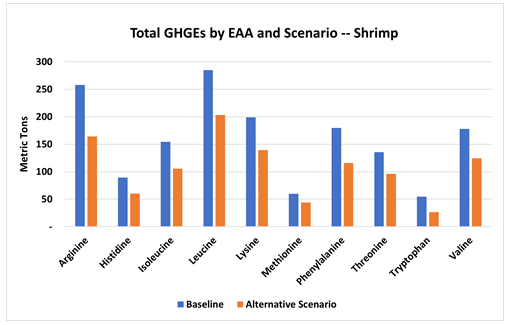
The total GHGEs by EAA and scenario for shrimp are shown in Figure 15. For Arginine, GHGEs decreased by 36.4% for the alternative scenario diet compared to the baseline diet. The percentage changes in GHGEs for other EAAs under the alternative scenario diet were as follows: Histidine by -32.5%, Isoleucine by -31.7%, Leucine by -28.7%, Lysine by -29.8%, Methionine by -26.3%, Phenylalanine by -35.5%, Threonine by -29.2%, Tryptophan by -51.8% and Valine by -6.7%. The data is also shown in Table 8.
A sensitivity report for the shrimp alternative scenario diet is shown in Table 7. The ingredients were sorted by their inclusion rate, with poultry byproduct meal (25.6%) and fish meal (16.1%) in the lead. The inclusion rates of other ingredients, from “Soybean oil” to “Feed Additives” remained the same as in the baseline diet. From the robustness index, the top three protein ingredients were meat and bone meal, poultry byproduct meal and fish meal, with values of 373.9%, 342.2% and 257.0%, respectively. Therefore, if the GHGE value of meat and bone meal increased within 373.9% of its current GHGE value (0.0068), the 8.6% inclusion rate would remain the same. Based on the model estimates, all feed ingredients in the shrimp diet, except for soybean meal, exhibited exceptional stability, indicating that the corresponding GHGE values would need to increase by more than double to even six times before a shift in the optimal ingredient mix was required. The sensitivity analysis demonstrates the high robustness of the shrimp alternative scenario diet formulation against potential uncertainties in LCA data.
For the shrimp alternative scenario analysis, the maximum inclusion cap was set to 125%, as the preliminary analysis showed that using the 150% cap would remove all plant-based proteins, which made the alternative scenario diet incomparable to the baseline diet. Soybean meal was the top ingredient used in the 10 commercial diets, so dropping it completely may not reflect reality. The ingredients listed in Table 7 with an asterisk are ingredients that hit the 125% maximum inclusion cap. The negative reduced costs, for instance, for poultry byproduct meal (-0.0248) and fish meal (-0.0231), indicated that while further GHGE reductions were mathematically possible, the current formulation prioritized nutrient balance over absolute GHGE minimization.
Table 7. Sensitivity and robustness analysis of the alternative scenario diet for shrimp.
| Feed Ingredient | Final Value 1 (%) | Reduced Cost | GHGEs (MT CO2e/MT Ingredient) | Allowable Increase (MT CO2e/MT Ingredient) | Robustness Index 2 (%) |
| Poultry Byproduct Meal * | 25.6 | -0.0248 | 0.0073 | 0.0248 | 342.2% |
| Fish Meal * | 16.1 | -0.0231 | 0.0090 | 0.0231 | 257.0% |
| Soybean Meal | 13.5 | 0.0000 | 0.0321 | 0.0033 | 10.2% |
| Wheat * | 11.0 | -0.0279 | 0.0042 | 0.0279 | 663.1% |
| Corn * | 10.6 | -0.0274 | 0.0048 | 0.0274 | 575.5% |
| Meat and Bone Meal * | 8.6 | -0.0253 | 0.0068 | 0.0253 | 373.9% |
| Corn Gluten Meal | 3.9 | -0.0141 | 0.0180 | 0.0141 | 78.6% |
| Gelatin | 0.0 | 0.1579 | 0.1900 | — 5 | NA 6 |
| Wheat Middlings | 0.0 | -0.0291 | 0.0030 | — | NA |
| Wheat Gluten Meal | 0.0 | 0.0033 | 0.0354 | — | NA |
| Soybean Oil | 1.0 | -0.0321 | NA 4 | — | NA |
| Fish Oil | 1.6 | -0.0321 | NA | — | NA |
| Inedible Tallow | 0.2 | -0.0321 | NA | — | NA |
| Lecithin | 0.9 | -0.0321 | NA | — | NA |
| Corn Starch | 4.2 | -0.0321 | NA | — | NA |
| Feed Additives 3 | 2.8 | -0.0321 | NA | — | NA |
1 “Final Value” represents the inclusion rate of a corresponding ingredient in the alternative scenario diet. 2 “Robustness Index” is calculated as “Allowable Increase” divided by “GHGEs”. 3 “Feed Additives” refer to an aggregation of all the relevant additives from the commercial diets for shrimp. 4 “NA” under the GHGE column indicates that a corresponding ingredient was not considered in this study but is present in the commercial diets. 5 Dash represents “1E+30” from the sensitivity report generated by Excel Solver. 6 Data is not applicable because the allowable increase is equal to infinite. * Ingredient has hit the 150% cap.
All Studied Aquaculture Species Together
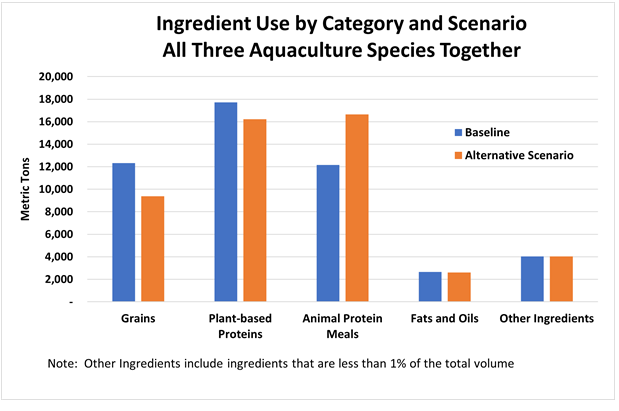
When considering all three studied aquaculture species together, minimizing GHGEs required reducing the use of grains by 23.6% and plant-based proteins by 8.5%, and increasing the use of animal proteins by 36.1%, while there was no change in the contents of fats and oils or other ingredients, as shown in Figure 16.
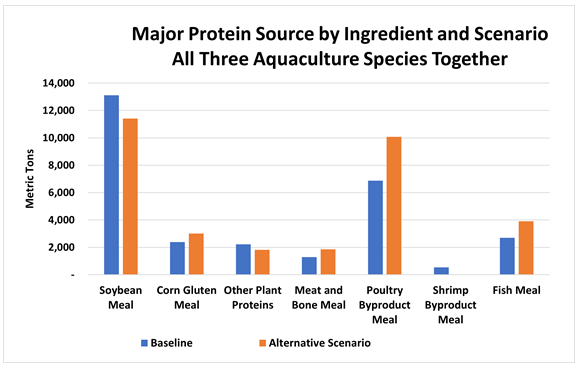
The major protein sources by ingredient and scenario considering all three studied aquaculture species together are shown in Figure 17. To minimize GHGEs while meeting other constraints, it would require decreasing the use of soybean meal by 12.9% and other plan-based meals by 18.2%, increasing corn gluten meal by 26.4%, increasing animal proteins and meat and bone meal by 43.6%, increasing poultry byproduct meal by 46.6%, decreasing shrimp byproduct meal by 100%, and increasing fish meal by 44.4%.
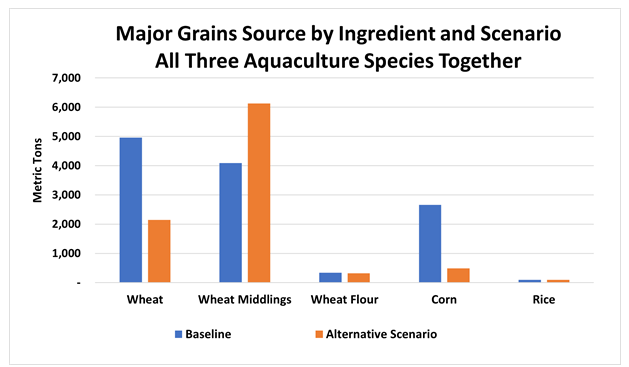
The major grain sources by ingredient and scenario for all three studied aquaculture species together are shown in Figure 18. Minimizing GHGEs required decreasing the use of whole grains such as wheat (down by 56.7%) and corn (down by 81.5%), while increasing grain byproducts such as wheat middlings (up by 50%). In addition, the inclusion of primary processed grain products such as wheat flour also decreased (down by 5.2%). There was no change in the content of rice in the alternative scenario.
The feed ingredients used in both the baseline and alternative scenario for the studied aquaculture species are shown in Appendix Table A1. The GHGEs for selected feed ingredients by scenario and species are shown in Appendix Table A2, and the GHGEs by EAA and scenario for all three studied aquaculture species together are shown in Appendix Table A3.
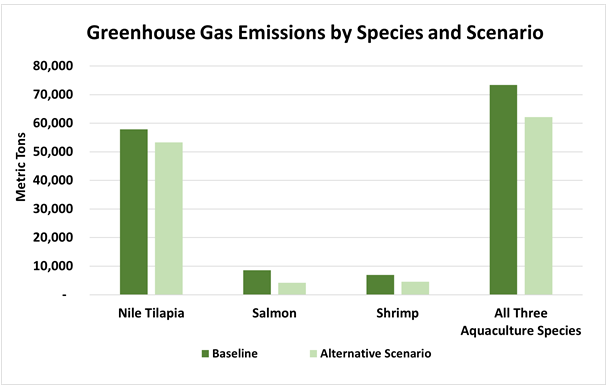
The GHGEs for the three studied species by scenario are shown in Figure 19. In the baseline case, Nile tilapia feed accounted for 57.8 thousand MT of CO2 emissions, salmon feed accounted for 8.6 thousand MT of CO2 emissions, and shrimp feed accounted for 6.9 thousand MT of CO2 emissions, with the total for all three species at 73.3 thousand MT of emissions. In the alternative scenario, Nile tilapia feed accounted for 53.3 thousand MT of CO2 emissions, salmon feed accounted for 4.2 thousand tons of CO2 emissions, and shrimp feed accounted for 4.6 thousand MT of CO2 emissions. In the alternative scenario, the GHGEs were reduced to 62.1 thousand MT of CO2 emissions for all three aquaculture species together, a decrease of 15% relative to the baseline.
The total GHGEs by EAA and scenario for all three studied aquaculture species are shown in Figure 20, and the percentage changes in GHGEs by EAA and species from the baseline are shown in Table 8. For Arginine, GHGEs decreased by 11.1% in the alternative scenario compared to the baseline. The percentage changes in GHGEs for other EAAs under the alternative scenario were as follows: Histidine by -9.3%, Isoleucine by -8.8%, Leucine by -5.7%, Lysine by -9.0%, Methionine by -4.5%, Phenylalanine by -13.0%, Threonine by -8.0%, Tryptophan by -29.3% and Valine by -6.7%.
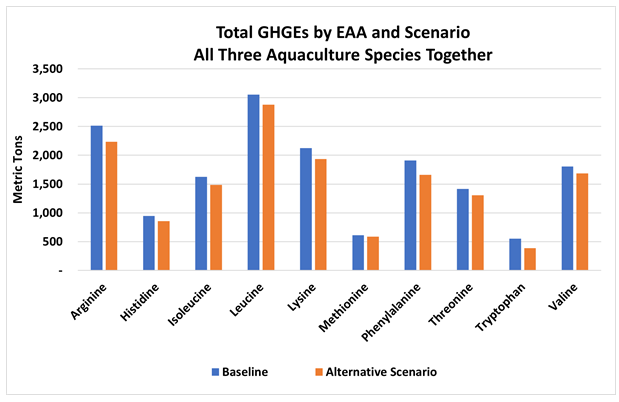
Table 8. Percentage changes in GHGEs by EAA and species relative to baseline diets.
| Species | Arginine | Histidine | Isoleucine | Leucine | Lysine | Methionine | Phenylalanine | Threonine | Tryptophan | Valine |
| Nile Tilapia | -2.8% | -2.1% | -2.5% | 3.0% | -2.6% | -0.2% | -5.6% | -1.0% | -18.1% | -0.5% |
| Salmon Shrimp All Three Species Together | -48.0% | -42.1% | -39.6% | -42.5% | -41.5% | -18.2% | -46.6% | -39.8% | -72.8% | -31.9% |
| -36.4% | -32.5% | -31.7% | -28.7% | -29.8% | -26.3% | -35.5% | -29.2% | -51.8% | -30.0% | |
| -11.1% | -9.3% | -8.8% | -5.7% | -9.0% | -4.5% | -13.0% | -8.0% | -29.3% | -6.7% |
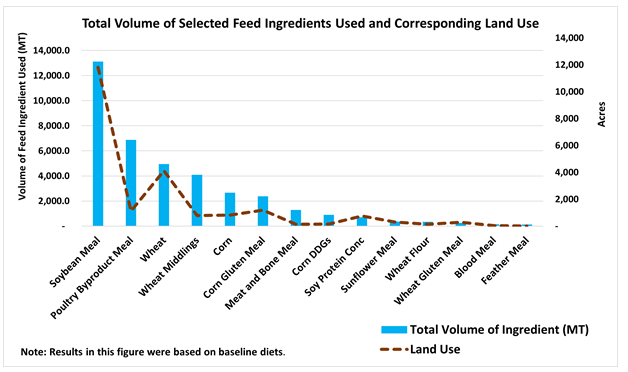
Based on the volume of each feed ingredient used in 2022 (according to the baseline analysis) for Nile tilapia, salmon and shrimp, the total land used (number of acres) to produce the corresponding quantity of ingredient (in MT) was estimated. The land use data for the ingredients came from the GFLI database. Figure 21 shows the land area for each ingredient based on the volumes consumed in 2022 according to the baseline analysis. Soybean meal was the top feed ingredient used (in terms of quantity) in the aquaculture diets, requiring the largest land area. For 13,107.8 MT of soybean used in the aquaculture diets, 11,807 acres of land were required (Figure 21). Although the quantity of poultry byproduct meal (6,874.4 MT) used in the aquaculture diets was larger than that of wheat (4,954.6 MT), the land use estimation (acres) was much larger for wheat (4,114 acres) than that for poultry byproduct meal (1,128 acres), as the former had a higher land use factor (0.83 acres / MT ingredient) than the latter (0.16 acres / MT ingredient).
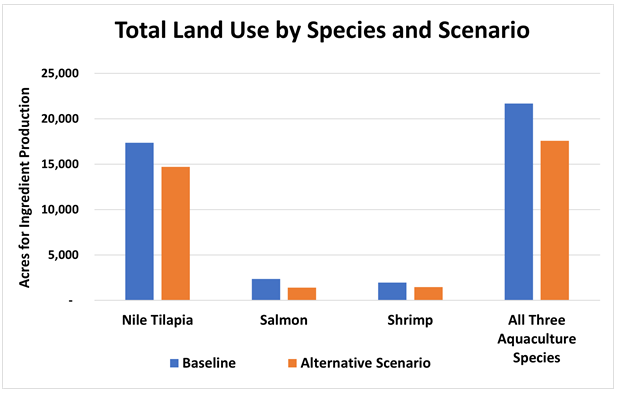
The land use analysis showed a 20% overall reduction in land use for the aquaculture diets under the alternative scenario compared with the baseline. The land use reduced by 16% for Nile tilapia compared with the baseline, while for salmon and shrimp, there was a 40% and 27% reduction in land use, respectively, as shown in Figure 22.
Discussion and Conclusions
In this study, baseline ingredients used in the diets of the studied aquaculture species were estimated from U.S. production in 2022. GHGE estimates were made at the ingredient level and for each of the essential amino acids in those ingredients. Then, an alternative scenario was analyzed in which the nutrient requirements of each species were met while minimizing the greenhouse gas emissions, subject to constraints placed on the increase in the inclusion rate of each ingredient.
This study builds upon well-established knowledge that feed consumption drives aquaculture GHGE, but expands upon that knowledge through its optimization framework. Beyond the amino acid level disaggregation, this study provides: species-specific sensitivity, demonstrating that GHGE mitigation strategies are not universal, noting for instance, the distinct response of Nile tilapia to grain-based diets reveals that “one-size-fits-all” feed policies are insufficient. Secondly, this study integrates real-world constraints by using actual commercial baseline diets rather than theoretical formulations which provides a more accurate assessment of the practical mitigation potential currently available to industry. And thirdly, the study provides for the identification of specific “pivot” ingredients that balance nutritional integrity with environmental targets at a level of detail previously unavailable in broader LCA studies.
For all studied species (Nile tilapia, salmon and shrimp), the primary ration adjustments resulted in a substitution of animal-based protein meals for grains and plant-based protein meals. Nile tilapia is the only species in which GHGEs were reduced via the incorporation of more grains while, for salmon and shrimp, GHGEs were reduced via protein sources. In the alternative scenario aimed at minimizing GHGEs, for all studied species, the results showed a 12.9% reduction in soybean meal use, a 26.4% increase in corn gluten meal, an 18.2% decrease in other plant-based proteins, a 43.6% increase in meat and bone meal, a 46.6% increase in poultry byproduct meal, a 44.4% increase in fish meal, and the removal of shrimp byproduct meal. To assess the practical feasibility of our optimized scenario, we compared the projected increases in corn gluten meal, meat and bone meal, poultry byproduct meal, and fish mealagainst current industry reports of total U.S. feed demand. The feed demand for these ingredients under the alternative scenario diets was 5.4 thousand MT, 1.3 thousand MT, 7.3 thousand MT and 3.5 thousand MT, respectively. Based on an industry report in 2023, the total feed demand for corn gluten meal, meat and bone meal, and poultry byproduct meal was 0.9 million MT, 1.1 million MT and 2.0 million MT, respectively [32]. The estimated global fish meal production in 2025 was 6.4 million MT, with over 80% being used for feed [33,34]. Our analysis indicates that the additional requirements for these ingredients represent a marginal proportion of total market usage. Therefore, the proposed formulations are considered feasible and unlikely to cause significant market displacement or supply chain disruptions.
Moreover, based on model assumptions, the total GHGEs for all three studied aquaculture species were reduced by 15.3%, from 73.3 thousand MT of GHGEs in the baseline case to 62.1 thousand MT of GHGEs in the alternative scenario. In the alternative scenario, total GHGEs were reduced by 7.8%, 50.8% and 33.4% for Nile tilapia, salmon and shrimp, respectively. The GHGEs for all EAAs were substantially reduced with the alternative scenario rations. For all three studied species, the reductions ranged from 29.3% for Tryptophan to 4.5% for Methionine across the EAAs.
The land use analysis showed a 20% overall reduction in land use for the aquaculture diets under the alternative scenario compared with the baseline. The estimates showed a reduction of 16% in land use for Nile tilapia compared with the baseline. For salmon and shrimp, land use reductions of 40% and 27% were estimated, respectively. Therefore, from an environmental perspective, using rendered animal protein meals to formulate the diets of the studied aquaculture species leads to a lower CO2 emission intensity and requires fewer acres of total land compared to using plant-based meals.
There are some limitations to this study that should be addressed in future studies. First, when analyzing the baseline and alternative scenario diets, feed additives were not considered in the models, and including feed additives may affect the ingredient inclusion rates; in particular, changes to supplemental synthetic amino acids may affect the inclusion rates of protein ingredients. In addition, these micro-components often have a higher carbon intensity during production than the primary ration ingredients, and their omission may skew the total GHGE results. Second, using the same combination of feed ingredients in the alternative scenario diets excludes the possibility of finding other potential ingredients that could lower GHGE values. Third, the proportional methodology of GHGE allocation to amino acids within a feed ingredient was used and it is recognized that there may be alternative methodology for allocating GHGE to EAA fraction based on dietary importance of the EAAs. Fourth, the maximum ingredient constraints were set as 150% for Nile Tilapia and salmon and 125% for shrimp, with only one maximum level used for each species. Future research could expand these to different maximum levels and perform comparisons across different scenarios. Another limitation is the assumption that the nutritionally balanced alternative scenario diets would perform as well as the baseline diets with respect to overall production, feed efficiency, digestibility and palatability. This assumption would need to be tested through feeding trials. Also, ingredients that perform favorably in one species may not provide the same nutritional or environmental advantages in another species. While species-specific commercial diets and digestibility coefficients were incorporated into the analysis to account for these differences, the results should not be interpreted as indicating that a single optimal ingredient strategy is universally applicable across all aquaculture systems. Future studies should evaluate these sustainability tradeoffs in additional species and validate the modeled outcomes through species-specific feeding trials. Finally, only 4 commercial diets were used to formulate the baseline diet for Nile tilapia, while, for shrimp, 10 commercial diets were used. Thus, the baseline diet for Nile tilapia may have less generalizability compared to that for shrimp.
In conclusion, this study demonstrated that strategic reformulation of aquaculture feeds can substantially reduce environmental impacts while maintaining the nutritional requirements of Nile tilapia, salmon, and shrimp. Across all three species, replacing a portion of plant-based protein meals and/or grains with greater use of rendered animal protein meals reduced estimated greenhouse gas emissions by 15.3% and land use by approximately 20% relative to baseline commercial diets. The magnitude of greenhouse gas reduction varied by species, ranging from 7.8% for Nile tilapia to 50.8% for salmon and 33.4% for shrimp. These reductions were achieved while satisfying dietary energy, protein, fat, and essential amino acid requirements. The analysis also indicated that the increased use of rendered animal proteins would require only a relatively small proportion of existing feed ingredient supplies, suggesting that the proposed formulations are commercially feasible. The sustainability implications of these findings extend beyond greenhouse gas mitigation alone. Rendered animal protein meals are derived from livestock processing co-products that might otherwise require disposal or lower value uses, thereby contributing to circular bioeconomy principles and improved resource efficiency. Increasing the use of these ingredients in aquaculture feeds can reduce reliance on crops that require dedicated agricultural land and associated inputs such as fertilizers, fuel, and irrigation resources. The observed reductions in both greenhouse gas emissions and land use suggest that feed formulation strategies incorporating appropriate levels of rendered animal proteins can help decouple aquaculture growth from increasing pressure on agricultural resources. These findings indicate that ingredient selection should be considered a key component of climate-smart aquaculture production systems and that rendered animal protein meals may provide a practical pathway for improving environmental performance while maintaining feed quality and nutritional adequacy.
Author Contributions
| Author Contribution | Contributor(s) |
| Designing the work | David A Miller |
| Conducting experimental procedures | David A Miller and Jing Tang |
| Data acquisition | Jing Tang and S. Patricia Batres-Marquez |
| Analysis and interpretation | Jing Tang and S. Patricia Batres-Marquez |
| Compilation | Jing Tang |
| Validations | David A Miller and Jing Tang |
| Funding acquisition | David L Meeker |
| Agreement to the published version | All authors have read and agreed to the published version of the manuscript. |
Funding: This work has been supported by funds from the Fats and Proteins Research Foundation, Alexandria, Virginia, U.S.
Data Availability Statement: The feed utilization and calculated GHGE data supporting the conclusions of this article will be made available by the authors on request. The raw GHGE data from the data sources listed in Data and Methods section may only be available as of the time of this re-search. And some data sources may require membership for access.
Acknowledgments: Authors would like to thank the Fats and Protein Research Foundation for supporting this research.
Conflicts of Interest: The authors declare no conflicts of interest.
Abbreviations
The following abbreviations are used in this manuscript:
| Abbreviation | Description |
| AD | Apparent Digestibility |
| CO2e | Carbon Dioxide Equivalent |
| Corn DDGs | Corn Dried Distillers Grains |
| CP | Crude Protein |
| EA | Economic Allocation |
| EAA | Essential Amino Acid |
| EU | European Union |
| FAO | Food and Agriculture Organization of the United Nations |
| GFLI | Global Feed LCA Institute |
| GHGE | Green House Gas Emission |
| LCA | Life Cycle Assessment |
| MT | Metric Tons |
| NAL | National Agricultural Library |
| NANP | National Animal Nutrition Program |
| NARA | North American Renderers Association |
| NASS | National Agricultural Statistics Service |
| PEF | Product Environmental Footprint |
| U.S. | United States |
| USDA | United States Department of Agriculture |
Appendix A
Appendix A.1 Ingredient Usage by Species and Scenario in Metric Tons
Table A1. Ingredient usage by species and scenario (in Metric Tons).
| Ingredient Aggregation | Ingredient | Nile Tilapia-Baseline | Nile Tilapia-Scenario | Salmon-Baseline | Salmon-Scenario | Shrimp-Baseline | Shrimp-Scenario | Studied Aquaculture Total-Baseline | Studied Aquaculture Total-Scenario |
| Animal Protein Meals | Meat and Bone Meal | 965.5 | 1,448.3 | – | – | 320.3 | 400.4 | 1,285.9 | 1,848.7 |
| Poultry Byproduct Meal | 4,977.0 | 7,465.5 | 948.0 | 1,422.1 | 949.4 | 1,186.7 | 6,874.4 | 10,074.2 | |
| Shrimp Byproduct Meal | 542.9 | – | – | – | – | – | 542.9 | – | |
| Fish Meal1 | 1,312.1 | 1,968.2 | 787.6 | 1,181.4 | 598.9 | 748.6 | 2,698.6 | 3,898.2 | |
| Fish2 | 144.8 | 217.2 | – | – | – | – | 144.8 | 217.2 | |
| Poultry Meal | – | – | 321.5 | 209.0 | – | – | 321.5 | 209.0 | |
| Feather Meal | – | – | 127.0 | 190.5 | – | – | 127.0 | 190.5 | |
| Blood Meal | – | – | 141.4 | 204.9 | – | – | 141.4 | 204.9 | |
| Gelatin | – | – | – | – | 30.9 | – | 30.9 | – | |
| Plant-based Proteins | Soybean Meal | 11,718.5 | 10,783.8 | 321.5 | – | 1,067.8 | 627.5 | 13,107.8 | 11,411.3 |
| Corn Gluten Meal | 1,628.8 | 2,443.2 | 602.6 | 378.1 | 144.4 | 180.5 | 2,375.9 | 3,001.9 | |
| Wheat Gluten Meal | – | – | 16.1 | – | 232.1 | – | 248.2 | – | |
| Soy Protein Conc | – | – | 706.7 | – | – | – | 706.7 | – | |
| Sunflower Meal | – | – | 368.1 | 459.7 | – | – | 368.1 | 459.7 | |
| Corn DDGs | 904.9 | 1,357.4 | – | – | – | – | 904.9 | 1,357.4 | |
| Grains | Wheat | 4,305.5 | 1,404.8 | 241.1 | 231.9 | 407.9 | 509.9 | 4,954.6 | 2,146.6 |
| Wheat Middlings | 3,348.1 | 5,022.2 | 737.3 | 1,105.9 | – | – | 4,085.4 | 6,128.1 | |
| Wheat Flour | – | – | 337.6 | 320.0 | – | – | 337.6 | 320.0 | |
| Corn | 2,262.3 | – | – | – | 392.3 | 490.4 | 2,654.5 | 490.4 | |
| Rice | 90.5 | 90.5 | – | – | – | – | 90.5 | 90.5 | |
| Corn Starch | – | – | – | – | 194.5 | 194.5 | 194.5 | 194.5 | |
| Fats & Oils | Inedible Tallow | – | – | – | – | 8.8 | 8.8 | 8.8 | 8.8 |
| Poultry Fat | – | – | 136.6 | 136.6 | – | – | 136.6 | 136.6 | |
| Fish Oil | 120.7 | 120.7 | 522.7 | 522.7 | 74.8 | 74.8 | 718.1 | 718.1 | |
| Lecithin | 90.5 | 90.5 | 185.1 | 185.1 | 43.8 | 43.8 | 319.4 | 319.4 | |
| Soybean Oil | 470.6 | 470.6 | 955.2 | 908.1 | 47.5 | 47.5 | 1,473.2 | 1,426.1 | |
| Other Ingredients | DL Methionine | 181.0 | 181.0 | 37.4 | 37.4 | – | – | 218.4 | 218.4 |
| Lysine | – | – | 128.2 | 128.2 | – | – | 128.2 | 128.2 | |
| Threonine | – | – | 10.9 | 10.9 | – | – | 10.9 | 10.9 | |
| Histidine | – | – | 13.4 | 13.4 | – | – | 13.4 | 13.4 | |
| Feed Additives | 3,132.5 | 3,132.5 | 391.1 | 391.1 | 129.0 | 129.0 | 3,652.5 | 3,652.5 | |
| Total | 36,196.2 | 36,196.2 | 8,036.9 | 8,036.9 | 4,642.5 | 4,642.5 | 48,875.5 | 48,875.5 | |
1 “Fish Meal” ingredient refers to rendered fish meal. 2 “Fish” ingredient refers to general marine fish.
Appendix A.2 GHGEs by Selected Ingredient by Scenario in Metric Tons
Table A2. GHGEs by selected ingredient by scenario (in Metric Tons).
| Ingredient Aggregation | Ingredient | Nile Tilapia-Baseline | Nile Tilapia-Scenario | Salmon-Baseline | Salmon-Scenario | Shrimp-Baseline | Shrimp-Scenario | Studied Aquaculture Total-Baseline | Studied Aquaculture Total-Scenario |
| Animal Protein Meals | Meat and Bone Meal | 654.1 | 981.2 | – | – | 217.0 | 271.3 | 871.1 | 1,252.4 |
| Feather Meal | – | – | 75.8 | 113.7 | – | – | 75.8 | 113.7 | |
| Poultry Meal | – | – | 210.1 | 136.6 | – | – | 210.1 | 136.6 | |
| Poultry Byproduct Meal | 3,613.3 | 5,419.9 | 688.3 | 1,032.4 | 689.3 | 861.6 | 4,990.8 | 7,313.9 | |
| Blood Meal | – | – | 126.9 | 183.8 | – | – | 126.9 | 183.8 | |
| Fish1 | 1,837.3 | 2,756.0 | – | – | – | – | 1,837.3 | 2,756.0 | |
| Fish Meal2 | 1,180.1 | 1,770.2 | 708.4 | 1,062.6 | 538.6 | 673.3 | 2,427.1 | 3,506.1 | |
| Shrimp Byproduct Meal | 5,266.5 | – | – | – | – | – | 5,266.5 | – | |
| Gelatin | – | – | – | – | 588.0 | – | 588.0 | – | |
| Plant-based Proteins | Soybean Meal | 37,615.0 | 34,614.7 | 1,031.9 | – | 3,427.4 | 2,014.3 | 42,074.3 | 36,628.9 |
| Corn DDGs | 861.0 | 1,291.5 | – | – | – | – | 861.0 | 1,291.5 | |
| Corn Gluten Meal | 2,928.6 | 4,392.9 | 1,083.5 | 679.8 | 259.7 | 324.6 | 4,271.8 | 5,397.4 | |
| Sunflower Meal | – | – | 302.2 | 377.4 | – | – | 302.2 | 377.4 | |
| Wheat Gluten Meal | – | – | 56.9 | – | 821.2 | – | 878.1 | – | |
| Soy Protein Conc | – | – | 3,771.9 | – | – | – | 3,771.9 | – | |
| Grains | Corn | 1,075.3 | – | – | – | 186.5 | 233.1 | 1,261.7 | 233.1 |
| Wheat | 1,811.6 | 591.1 | 101.4 | 97.6 | 171.6 | 214.5 | 2,084.6 | 903.2 | |
| Wheat Middlings | 1,003.9 | 1,505.9 | 221.1 | 331.6 | – | – | 1,225.0 | 1,837.5 | |
| Wheat Flour | – | – | 225.1 | 213.4 | – | – | 225.1 | 213.4 | |
| Total | 57,846.7 | 53,323.3 | 8,603.4 | 4,228.9 | 6,899.3 | 4,592.6 | 73,349.4 | 62,144.8 | |
1 “Fish” ingredient refers to general marine fish. 2 “Fish Meal” ingredient refers to rendered fish meal.
Appendix A.3 GHGEs by EAA by Ingredient Aggregation and Scenario in Metric Tons
Table A3. GHGEs by EAA by ingredient aggregation and scenario (in Metric Tons).
| Ingredient Aggregation | EAA | Nile Tilapia-Baseline | Nile Tilapia-Scenario | Salmon-Baseline | Salmon-Scenario | Shrimp-Baseline | Shrimp-Scenario | Studied Aquaculture Total-Baseline | Studied Aquaculture Total-Scenario |
| Animal Protein Meals | Arginine | 181.5 | 272.3 | 47.1 | 63.7 | 38.3 | 47.9 | 267.0 | 383.8 |
| Histidine | 51.6 | 77.4 | 18.3 | 25.3 | 11.1 | 13.9 | 81.1 | 116.6 | |
| Isoleucine | 102.8 | 154.2 | 27.1 | 36.4 | 21.1 | 26.4 | 151.0 | 217.1 | |
| Leucine | 188.3 | 282.4 | 59.7 | 81.6 | 39.2 | 49.0 | 287.2 | 413.0 | |
| Lysine | 122.8 | 184.2 | 37.2 | 50.5 | 26.1 | 32.7 | 186.1 | 267.4 | |
| Methionine | 38.2 | 57.2 | 9.9 | 13.3 | 8.0 | 10.0 | 56.0 | 80.5 | |
| Phenylalanine | 105.1 | 157.6 | 33.6 | 45.9 | 21.9 | 27.4 | 160.6 | 230.9 | |
| Threonine | 104.7 | 157.1 | 30.8 | 41.8 | 21.8 | 27.2 | 157.3 | 226.1 | |
| Tryptophan | 19.2 | 28.8 | 6.4 | 8.6 | 4.0 | 5.0 | 29.6 | 42.4 | |
| Valine | 144.3 | 216.4 | 45.8 | 62.6 | 29.9 | 37.4 | 220.0 | 316.4 | |
| Plant-based Proteins | Arginine | 1,516.3 | 1,437.1 | 70.3 | 24.2 | 137.1 | 84.2 | 1,723.7 | 1,545.4 |
| Histidine | 580.8 | 561.5 | 31.7 | 12.2 | 52.2 | 33.0 | 664.7 | 606.6 | |
| Isoleucine | 999.2 | 971.2 | 58.4 | 23.4 | 90.0 | 57.5 | 1,147.5 | 1,052.1 | |
| Leucine | 1,842.9 | 1,892.6 | 161.9 | 79.5 | 164.5 | 114.9 | 2,169.3 | 2,086.9 | |
| Lysine | 1,270.1 | 1,193.9 | 50.3 | 12.6 | 114.9 | 69.7 | 1,435.3 | 1,276.1 | |
| Methionine | 329.7 | 334.0 | 27.5 | 13.9 | 29.5 | 20.1 | 386.7 | 368.0 | |
| Phenylalanine | 1,140.4 | 1,125.6 | 76.1 | 33.0 | 102.5 | 67.2 | 1,319.0 | 1,225.8 | |
| Threonine | 826.8 | 804.3 | 48.4 | 19.6 | 74.3 | 47.5 | 949.5 | 871.4 | |
| Tryptophan | 289.0 | 272.8 | 12.5 | 3.9 | 26.1 | 15.9 | 327.6 | 292.7 | |
| Valine | 1,052.0 | 1,027.4 | 63.9 | 26.7 | 94.5 | 60.8 | 1,210.4 | 1,114.9 | |
| Grains | Arginine | 30.3 | 21.9 | 3.3 | 4.6 | 2.1 | 2.7 | 35.8 | 29.1 |
| Histidine | 14.0 | 9.1 | 1.4 | 1.9 | 1.1 | 1.4 | 16.4 | 12.4 | |
| Isoleucine | 19.9 | 12.1 | 1.9 | 2.5 | 1.6 | 2.0 | 23.4 | 16.6 | |
| Leucine | 42.7 | 23.0 | 3.5 | 4.7 | 3.9 | 4.9 | 50.2 | 32.6 | |
| Lysine | 17.8 | 13.3 | 2.0 | 2.8 | 1.2 | 1.6 | 21.1 | 17.6 | |
| Methionine | 9.4 | 5.6 | 0.9 | 1.1 | 0.8 | 1.0 | 11.1 | 7.7 | |
| Phenylalanine | 28.1 | 18.2 | 2.8 | 3.8 | 2.2 | 2.7 | 33.0 | 24.7 | |
| Threonine | 17.9 | 11.4 | 1.7 | 2.4 | 1.4 | 1.8 | 21.0 | 15.6 | |
| Tryptophan | 6.3 | 4.6 | 0.7 | 0.9 | 0.4 | 0.5 | 7.4 | 6.0 | |
| Valine | 25.6 | 16.3 | 2.5 | 3.4 | 2.0 | 2.5 | 30.1 | 22.2 | |
| Total | Arginine | 1,985.8 | 1,931.1 | 270.3 | 140.5 | 258.1 | 164.2 | 2,514.1 | 2,235.8 |
| Histidine | 754.1 | 738.1 | 101.5 | 58.8 | 89.2 | 60.2 | 944.7 | 857.0 | |
| Isoleucine | 1,316.9 | 1,283.6 | 155.8 | 94.1 | 154.5 | 105.5 | 1,627.2 | 1,483.2 | |
| Leucine | 2,380.8 | 2,453.2 | 385.6 | 221.6 | 284.8 | 203.0 | 3,051.3 | 2,877.8 | |
| Lysine | 1,716.3 | 1,672.6 | 210.3 | 123.0 | 198.8 | 139.6 | 2,125.4 | 1,935.2 | |
| Methionine | 492.3 | 491.6 | 60.0 | 49.0 | 59.7 | 44.0 | 611.9 | 584.6 | |
| Phenylalanine | 1,515.5 | 1,431.1 | 212.0 | 113.1 | 179.7 | 115.9 | 1,907.2 | 1,660.1 | |
| Threonine | 1,123.5 | 1,112.6 | 158.6 | 95.4 | 135.6 | 96.0 | 1,417.6 | 1,304.1 | |
| Tryptophan | 416.4 | 341.0 | 79.5 | 21.6 | 54.5 | 26.3 | 550.4 | 389.0 | |
| Valine | 1,436.2 | 1,429.2 | 192.8 | 131.4 | 177.9 | 124.5 | 1,807.0 | 1,685.1 |
Appendix A.4 GHGEs by Ingredient with Sources
Table A4. GHGEs by ingredient with sources.
| Ingredient | MT CO2e/MT ingredient | Source |
| Gelatin | 19.0 | Carbon Cloud[35] |
| Fish1 | 12.7 | Quantifying greenhouse gas emissions from global aquaculture[36] |
| Shrimp Byproduct Meal | 9.7 | Evaluation of Different Aquaculture Feed Ingredients in Indonesia Using Life Cycle Assessment[37] |
| Soy Protein Conc | 5.3 | GFLI[20] |
| Wheat Gluten Meal | 3.5 | GFLI[20] |
| Soybean Meal | 3.2 | GFLI[20] |
| Corn Gluten Meal | 1.8 | Feed Tables[23] |
| Corn DDGs | 1.0 | GFLI[20] |
| Fish Meal2 | 0.9 | GFLI[20] |
| Blood Meal | 0.9 | GFLI[20] |
| Sunflower Meal | 0.8 | GFLI[20] |
| Poultry Byproduct Meal | 0.7 | Life-cycle assessment of animal feed ingredients: Poultry by-product meal and hydrolyzed feather meal[38] |
| Meat and Bone Meal | 0.7 | GFLI[20] |
| Wheat Flour | 0.7 | GFLI[20] |
| Poultry Meal | 0.7 | Life-cycle assessment of animal feed ingredients: Poultry by-product meal and hydrolyzed feather meal[38] |
| Feather Meal | 0.6 | Life-cycle assessment of animal feed ingredients: Poultry by-product meal and hydrolyzed feather meal[38] |
| Corn | 0.5 | GFLI[20] |
| Wheat | 0.4 | GFLI[20] |
| Wheat Middlings | 0.3 | GFLI[20] |
1 “Fish” ingredient refers to general marine fish. 2 “Fish Meal” ingredient refers to rendered fish meal.
Appendix A.5 Apparent Digestibility of Crude Protein by Ingredient by Species with Sources
Table A5. Apparent digestibility of crude protein by ingredient by species with sources.
| Species | Ingredient | Apparent Digestibility of Crude Protein (%) | Source |
| Nile Tilapia | Soybean Meal | 87.4 | Köprücü et al. [39] |
| Poultry Byproduct Meal | 98.1 | HernãNdez et al.[40] | |
| Wheat | 75 | Sklan et al. [41] | |
| Wheat Middlings | 73.74 | Felipe Barbosa Ribeiro et al. [42] | |
| Corn | 74.69 | Felipe Barbosa Ribeiro et al. [42] | |
| Corn Gluten Meal | 89 | Köprücü et al. [39] | |
| Fish Meal1 | 90.5 | Köprücü et al. [39] | |
| Meat and Bone Meal | 92.3 | HernãNdez et al. [40] | |
| Corn DDGs | 85 | Welker et al. [43] | |
| Shrimp Byproduct Meal | 92.4 | Mmanda et al. [44] | |
| Fish2 | 80 | Zhou et al. [45] | |
| Salmon | Poultry Byproduct Meal | 87.92 | Fowler [46] |
| Fish Meal1 | 91.67 | Yu et al. [47] | |
| Wheat Middlings | 80 | Sugiura et al. [48] | |
| Soy Protein Conc | 86.75 | Lu et al. [49] | |
| Corn Gluten Meal | 84.89 | Lu et al. [49] | |
| Sunflower Meal | 86.6 | Feed Tables [23] | |
| Wheat Flour | 80 | Sugiura et al. [48] | |
| Poultry Meal | 87.92 | Fowler [46] | |
| Soybean Meal | 86.4 | Lu et al. [49] | |
| Wheat | 83.3 | Feed Tables [23] | |
| Blood Meal | 92.3 | Feed Tables [23] | |
| Feather Meal | 74.12 | Yu et al. [47] | |
| Wheat Gluten Meal | 99 | Storebakken et al.[50] | |
| Shrimp | Soybean Meal | 92.5 | Qiu et al. [51] |
| Poultry Byproduct Meal | 90 | Cruz-Suárez et al. [52] | |
| Fish Meal1 | 84 | Terrazas-Fierro et al. [53] | |
| Wheat | 90 | Nieto-López et al. [54] | |
| Corn | 75 | Martín Terrazas et al. [55] | |
| Meat and Bone Meal | 71.2 | Vieira et al. [27] | |
| Wheat Gluten Meal | 99 | Argüello-Guevara et al. [56] | |
| Corn Gluten Meal | 84.45 | Lin et al. [57] |
1 “Fish Meal” ingredient refers to rendered fish meal. 2 “Fish” ingredient refers to general marine fish.
Appendix A.6 Nutritional Composition by Studied Protein Ingredient
Table A6. Nutritional Composition by Studied Protein Ingredient1
| Ingredient | Crude Protein | Crude Fat | Crude Fiber |
| Blood Meal | 87.7 | 1.9 | 0.8 |
| Corn | 7.6 | 3.6 | 2.3 |
| Corn DDGs | 24.6 | 4.5 | 7.4 |
| Corn Gluten Meal | 61.6 | 6 | 1.4 |
| Feather Meal | 78.9 | 8.5 | 1.3 |
| Fish Meal | 65.2 | 9.2 | 0 |
| Meat and Bone Meal | 52.7 | 10.9 | 0 |
| Poultry Byproduct Meal | 55.6 | 25.7 | 0 |
| Poultry Meal | 63.2 | 21.7 | 0 |
| Soybean Meal | 46.2 | 1.5 | 6 |
| Sunflower Meal | 36.6 | 1.2 | 17.8 |
| Wheat | 14.4 | 1.8 | 2.7 |
| Wheat Gluten Meal | 79.8 | 1.6 | 0.6 |
| Wheat Middlings | 15.7 | 4.2 | 7 |
1 Data source: Feed Tables [23] and Feedipedia [24]
Table A7. Essential Amino Acids Composition (% of Crude Protein) of Studied Protein Ingredients1
| Ingredient | Arginine | Histidine | Isoleucine | Leucine | Lysine | Methionine | Phenylalanine | Threonine | Tryptophan | Valine |
| Blood Meal | 4.3 | 6.3 | 1.3 | 12.2 | 8.7 | 1.2 | 6.9 | 4.6 | 1.5 | 8.5 |
| Corn | 4.8 | 2.9 | 3.7 | 12.2 | 3.1 | 2.1 | 4.8 | 3.7 | 0.7 | 5 |
| Corn DDGs | 4.2 | 2.7 | 3.6 | 10.4 | 2.9 | 1.9 | 4.5 | 3.6 | 0.7 | 4.9 |
| Corn Gluten Meal | 3.1 | 2 | 4 | 15.6 | 1.8 | 2.4 | 6 | 3.3 | 0.5 | 4.5 |
| Feather Meal | 6.8 | 0.9 | 4.9 | 8.1 | 2.3 | 0.7 | 4.8 | 4.6 | 0.6 | 7.4 |
| Fish Meal | 6.2 | 2.5 | 4.1 | 7.2 | 7.5 | 2.7 | 3.9 | 4.1 | 1 | 5 |
| Meat and Bone Meal | 6.9 | 2.1 | 2.9 | 6 | 5 | 1.3 | 3.4 | 3.3 | 0.6 | 4.4 |
| Poultry Byproduct Meal | 6.6 | 1.8 | 3.9 | 7 | 4.4 | 1.4 | 3.9 | 3.9 | 0.7 | 5.4 |
| Poultry Meal | 4.5 | 1.3 | 2.7 | 4.8 | 3.3 | 1.2 | 2.7 | 2.7 | 0.5 | 3.5 |
| Soybean Meal | 7.3 | 2.7 | 4.6 | 7.6 | 6.2 | 1.4 | 5.1 | 3.8 | 1.4 | 4.8 |
| Sunflower Meal | 8.2 | 2.4 | 4.1 | 6.1 | 3.6 | 2.2 | 4.4 | 3.6 | 1.3 | 4.9 |
| Wheat | 4.8 | 2.2 | 3.6 | 6.8 | 2.6 | 1.6 | 4.9 | 2.9 | 1.1 | 4.3 |
| Wheat Gluten Meal | 3.6 | 1.8 | 3.1 | 5.7 | 1.6 | 1.2 | 4.5 | 2.3 | 0.7 | 3.4 |
| Wheat Middlings | 6.4 | 2.6 | 3.2 | 6.1 | 4 | 1.5 | 4 | 3.2 | 1.3 | 4.5 |
1. Data source: Feed Tables [23] and Feedipedia [24]
Appendix A.7 Allocation GHGEs in Crude Protin of Selected Ingredients by EAA Content
Data on the amino acid fractional content of the feed ingredients was used to allocate the GHGE intensity for each feed ingredient in the study to its amino acid fraction and taking the crude protein content in each ingredient, with quantities stated in MT CO2e/MT ingredient. The allocations for selected ingredients used in this study are shown in Figure A1.
Appendix A.8 Allocation GHGEs by Ingredients by EAA
Figure A2 to Figure A11 show the metric tons of GHGE per Kg of selected EAA in the major plant and animal protein meal ingredients. Besides the GHGE, the percentage of crude protein in each ingredient and its corresponding percent content of each EAA was taken into consideration in these estimates. Due to the range of GHGE per amino acids for the different feed ingredients, GHGE can be reduced by changing the ingredients used in aquaculture under the assumptions from this study.
Reference
- Hua, K., Cobcroft, J. M., Cole, A., Condon, K., Jerry, D. R., Mangott, A., Praeger, C., Vucko, M. J., Zeng, C., Zenger, K., & Strugnell, J. M. (2019). The Future of Aquatic Protein: Implications for Protein Sources in Aquaculture Diets. One Earth, 1(3), 316–329. https://doi.org/10.1016/j.oneear.2019.10.018
- Food and Agriculture Organization of the United Nations. (2025). FishStatJ Software for Fisheries and Aquaculture Statistical Time Series [Dataset]. https://www.fao.org/fishery/en/statistics/software/fishstatj
- Davis, G.D. (2025, June). Aquaculture [USDA Economic Research Service]. USDA Economic Research Service. https://www.ers.usda.gov/topics/animal-products/aquaculture
- Posadas, B. C. (2022, October 18). U.S. Salmon Aquaculture Production And Prices. Mississippi MarketMaker, 12(10). https://extension.msstate.edu/newsletters/mississippi-marketmaker/2022/vol-12-no-10-us-salmon-aquaculture-production-and-prices
- The U.S. Tilapia Aquaculture Industry Has Been Slowing Down. (2023). Mississippi MarketMaker, 13(5). https://extension.msstate.edu/newsletters/mississippi-marketmaker/2023/vol-13-no-5-the-us-tilapia-aquaculture-industry-has-been-slowing-down
- Mississippi State University Coastal Research and Extension Center. (2023). Saltwater Shrimp Aquaculture Production, Farm-gate Values and Prices in the United States. https://coastal.msstate.edu/saltwater-shrimp-aquaculture-production-farm-gate-values-and-prices-united-states
- National Oceanic and Atmospheric Administration. (2022, September 20). U.S. Aquaculture. NOAA Fisheries. https://www.fisheries.noaa.gov/national/aquaculture/us-aquaculture
- Naylor, R. L., Hardy, R. W., Buschmann, A. H., Bush, S. R., Cao, L., Klinger, D. H., Little, D. C., Lubchenco, J., Shumway, S. E., & Troell, M. (2021). A 20-year retrospective review of global aquaculture. Nature, 591(7851), 551–563. https://doi.org/10.1038/s41586-021-03308-6
- Boyd, C. E., & McNevin, A. A. (2024). Resource Use and Pollution Potential in Feed-Based Aquaculture. Reviews in Fisheries Science & Aquaculture, 32(2), 306–333. https://doi.org/10.1080/23308249.2023.2258226
- Tacon, A. G. J., Metian, M., & McNevin, A. A. (2022). Future Feeds: Suggested Guidelines for Sustainable Development. Reviews in Fisheries Science & Aquaculture, 30(2), 135–142. https://doi.org/10.1080/23308249.2020.1860474
- Boyd, C. E., D’Abramo, L. R., Glencross, B. D., Huyben, D. C., Juarez, L. M., Lockwood, G. S., McNevin, A. A., Tacon, A. G. J., Teletchea, F., Tomasso, J. R., Tucker, C. S., & Valenti, W. C. (2020). Achieving sustainable aquaculture: Historical and current perspectives and future needs and challenges. Journal of the World Aquaculture Society, 51(3), 578–633. https://doi.org/10.1111/jwas.12714
- Ghamkhar, R., & Hicks, A. (2020). Comparative environmental impact assessment of aquafeed production: Sustainability implications of forage fish meal and oil free diets. Resources, Conservation and Recycling, 161, 104849. https://doi.org/10.1016/j.resconrec.2020.104849
- Ecochain. (2024, February). Life Cycle Assessment (LCA) Guide – Everything you need to know. Ecochain. https://ecochain.com/blog/life-cycle-assessment-lca-guide/
- Guyomarc’h, F., Héquet, F., Le Féon, S., Leconte, N., Garnier-Lambrouin, F., Auberger, J., Malnoë, C., Pénicaud, C., & Gésan-Guiziou, G. (2024). Life cycle assessment to quantify the environmental performance of multi-products food processing systems such as milk fractionation: Importance of subdivision and allocation. Journal of Food Engineering, 380, 112147. https://doi.org/10.1016/j.jfoodeng.2024.112147
- EPA. (2025, May). Lifecycle Analysis of Greenhouse Gas Emissions under the Renewable Fuel Standard. Lifecycle Analysis of Greenhouse Gas Emissions under the Renewable Fuel Standard. https://www.epa.gov/renewable-fuel-standard/lifecycle-analysis-greenhouse-gas-emissions-under-renewable-fuel-standard
- Goglio, P., Van Den Burg, S., Kousoulaki, K., Skirtun, M., Espmark, Å. M., Kettunen, A. H., & Abbink, W. (2022). The Environmental Impact of Partial Substitution of Fish-Based Feed with Algae- and Insect-Based Feed in Salmon Farming. Sustainability, 14(19), 12650. https://doi.org/10.3390/su141912650
- Parker, R. (2018). Implications of high animal by-product feed inputs in life cycle assessments of farmed Atlantic salmon. The International Journal of Life Cycle Assessment, 23(5), 982–994. https://doi.org/10.1007/s11367-017-1340-9
- Zhang, Y., Li, S., Yang, P., Zhang, Y., Lu, X., Tang, K. W., Yang, H., Wang, Z., Yu, G., Tong, C., Zhang, Z., Jiang, P., Wang, Y., Zhao, J., Yang, X., Zhang, L., & Xia, X. (2026). Revealing the unrecognized climate burden of aquaculture systems: A global insight into greenhouse gas emissions and mitigation strategies. Water Research, 292, 125389. https://doi.org/10.1016/j.watres.2026.125389
- Boissy, J., Aubin, J., Drissi, A., Van Der Werf, H. M. G., Bell, G. J., & Kaushik, S. J. (2011). Environmental impacts of plant-based salmonid diets at feed and farm scales. Aquaculture, 321(1–2), 61–70. https://doi.org/10.1016/j.aquaculture.2011.08.033
- Global Feed LCA Institute (GFLI). (2023). Global Feed LCA institute’s (GFLI) database (Version 1.0) [Dataset]. https://globalfeedlca.org/gfli-database/accessing-the-database/
- Global Feed LCA Institute (GFLI). (2021). GFLI guidance document: How to read and use the database. Global Feed LCA Institute. https://globalfeedlca.org/wp-content/uploads/2021/12/GFLI-Guidance-Document-December-2021.pdf
- European Commission. (2017). PEFCR Guidance document—Guidance for the13 development of Product Environmental Footprint Category Rules (PEFCRs) (Version 6.3). European Commission. https://eplca.jrc.ec.europa.eu/permalink/PEFCR_guidance_v6.3-2.pdf
- National Research Institute for Agriculture, Food and Environment, French Agricultural Research Centre for International Development, & French Association of Zootechny. (2004). INRAE-CIRAD-AFZ feed tables: Composition and nutritive values of feeds for cattle, sheep, goats, pigs, poultry, rabbits, horses, and salmonids. [Dataset]. https://www.feedtables.com/
- National Research Institute for Agriculture, Food and Environment, French Agricultural Research Centre for International Development, French Association of Zootechny, & Food and Agriculture Organization of the United Nations. (2012). Feedipedia [Dataset]. https://www.feedipedia.org/
- U.S. Department of Agriculture. (2024). USDA National Animal Nutrition Program [Dataset]. https://animalnutrition.org/modeling-database/publications
- Rahman, M. M., Gunathilaka, B. E., You, S.-G., Kim, K.-W., & Lee, S.-M. (2023). Apparent digestibility coefficients of plant feed ingredients for olive flounder (Paralichthys olivaceus). Fisheries and Aquatic Sciences, 26(2), 87–96. https://doi.org/10.47853/FAS.2023.e7
- Vieira, C. C. F., Pinto, R. C. C., Diógenes, A. F., & Nunes, A. J. P. (2022). Apparent digestibility of protein and essential aminoacids from commonly used feed ingredients in Brazil for juvenile shrimp Litopenaeus vannamei. Revista Brasileira de Zootecnia, 51, e20210177. https://doi.org/10.37496/rbz5120210177
- Stein, H. H., Fuller, M. F., Moughan, P. J., Sève, B., Mosenthin, R., Jansman, A. J. M., Fernández, J. A., & De Lange, C. F. M. (2007). Definition of apparent, true, and standardized ileal digestibility of amino acids in pigs. Livestock Science, 109(1–3), 282–285. https://doi.org/10.1016/j.livsci.2007.01.019
- Al Eissa, A., Chen, P., Brown, P. B., & Huang, J. (2022). Effects of feed formula and farming system on the environmental performance of shrimp production chain from a life cycle perspective. Journal of Industrial Ecology, 26(6), 2006–2019. https://doi.org/10.1111/jiec.13370
- Nesara, K.M. & Paturi, A.P. (2018). Nutritional Requirement of Fresh Water Prawn and Shrimp: A Review. Journal of Entomology and Zoology Studies, 6(4), 1526–1532.
- Ayisi, C. L., Hua, X., Apraku, A., Afriyie, G., & Kyei, B. A. (2017). Recent Studies Toward the Development of Practical Diets for Shrimp and Their Nutritional Requirements. HAYATI Journal of Biosciences, 24(3), 109–117. https://doi.org/10.1016/j.hjb.2017.09.004
- Fats and Proteins Research Foundation, The Institute for Feed Education and Research, & American Feed Industry Association. (2025). 2025 Animal Feed Consumption Report Results US Livestock, Poultry & Aquaculture Feed Consumption Trends & Sustainability Insights. https://nara.org/2025-animal-feed-consumption-report-results/
- Global Growth Insights. (2025). Fish Meal Market Size, Share, Growth, and Industry Analysis, by Types (Fertilizers, Feed, Others), by Applications Covered (Salmon & Trout, Marine Fish, Crustaceans, Tilapia, Others), Regional Insights and Forecast to 2035 (No. GGI107419). https://www.globalgrowthinsights.com/market-reports/fish-meal-market-107419
- Food and Agriculture Organization of the United Nations. (2025). GLOBEFISH Quarterly Fishmeal and Fish Oil Analysis. FAO GLOBEFISH Information and Analysis on Markets and Trade of Fisheries and Aquaculture Products. https://www.fao.org/in-action/globefish/species-analysis/fishmeal-and-fish-oil/en
- CarbonCloud. (2023). Technical Report—Climate Footprint of Bovine gelatin. CarbonCloud ClimateHub. https://apps.carboncloud.com/climatehub/product-reports/id/1698245310067
- MacLeod, M. J., Hasan, M. R., Robb, D. H. F., & Mamun-Ur-Rashid, M. (2020). Quantifying greenhouse gas emissions from global aquaculture. Scientific Reports, 10(1), 11679. https://doi.org/10.1038/s41598-020-68231-8
- Henriksson, P. J. G., Mohan, C. V., & Phillips, M. J. (2016). Evaluation of Different Aquaculture Feed Ingredients in Indonesia Using Life Cycle Assessment. Indonesian Journal of Life Cycle Assessment and Sustainability, 1(1). https://doi.org/10.52394/ijolcas.v1i1.4
- Campos, I., Pinheiro Valente, L. M., Matos, E., Marques, P., & Freire, F. (2020). Life-cycle assessment of animal feed ingredients: Poultry fat, poultry by-product meal and hydrolyzed feather meal. Journal of Cleaner Production, 252, 119845. https://doi.org/10.1016/j.jclepro.2019.119845
- Köprücü, K., & Özdemir, Y. (2005). Apparent digestibility of selected feed ingredients for Nile tilapia (Oreochromis niloticus). Aquaculture, 250(1–2), 308–316. https://doi.org/10.1016/j.aquaculture.2004.12.003
- HernãNdez, C., Olvera-Novoa, M. A., Hardy, R. W., Hermosillo, A., Reyes, C., & GonzãLez, B. (2010). Complete replacement of fish meal by porcine and poultry by-product meals in practical diets for fingerling Nile tilapia Oreochromis niloticus: Digestibility and growth performance. Aquaculture Nutrition, 16(1), 44–53. https://doi.org/10.1111/j.1365-2095.2008.00639.x
- Sklan, D., Prag, T., & Lupatsch, I. (2004). Apparent digestibility coefficients of feed ingredients and their prediction in diets for tilapia Oreochromis niloticus x Oreochromis aureus (Teleostei, Cichlidae). Aquaculture Research, 35(4), 358–364. https://doi.org/10.1111/j.1365-2109.2004.01021.x
- Ribeiro, F. B., Lanna, E. A. T., Bomfim, M. A. D., Donzele, J. L., Quadros, M., Cunha, P. D. S. L., Takishita, S. S., & Vianna, R. A. (2011). Apparent and true digestibility of protein and amino acid in feedstuffs used in Nile Tilapia feed as determined by the technique of dissection. Revista Brasileira de Zootecnia, 41(5), 1075–1081.
- Welker, T. L., Sealey, W., & Tan, R. (2024). Digestibility of corn distiller’s dried grains with solubles (DDGS) in practical feeds with phytase and xylanase treatment fed to Nile Tilapia. North American Journal of Aquaculture, 86(1), 154–162. https://doi.org/10.1002/naaq.10325
- Mmanda, F. P., Lindberg, J. E., Norman Haldén, A., Mtolera, M. S. P., Kitula, R., & Lundh, T. (2020). Digestibility of Local Feed Ingredients in Tilapia Oreochromis niloticus Juveniles, Determined on Faeces Collected by Siphoning or Stripping. Fishes, 5(4), 32. https://doi.org/10.3390/fishes5040032
- Zhou, Q. C., & Yue, Y. R. (2012). Apparent digestibility coefficients of selected feed ingredients for juvenile hybrid tilapia, Oreochromis niloticus×Oreochromis aureus: Apparent digestibility coefficients for hybrid tilapia. Aquaculture Research, 43(6), 806–814. https://doi.org/10.1111/j.1365-2109.2011.02892.x
- Fowler, L. G. (1991). Poultry by-product meal as a dietary protein source in fall chinook salmon diets. Aquaculture, 99(3–4), 309–321. https://doi.org/10.1016/0044-8486(91)90251-2
- Yu, H., Zhang, X., Yu, L., Zhang, J., Yan, R., Li, L., Sattanathan, G., & Rahman, A. (2025). Apparent Digestibility Coefficients of Seven Animal Protein Ingredients for Coho Salmon ( Oncorhynchus kisutch ) Post‐Smolts. Aquaculture Nutrition, 2025(1), 6645799. https://doi.org/10.1155/anu/6645799
- Sugiura, S. H., Dong, F. M., Rathbone, C. K., & Hardy, R. W. (1998). Apparent protein digestibility and mineral availabilities in various feed ingredients for salmonid feeds. Aquaculture, 159(3–4), 177–202. https://doi.org/10.1016/S0044-8486(97)00177-4
- Lu, B., Yu, L., Yu, H., Rahman, A., Ma, C., Wu, X., Li, L., Sherzada, S., & Hussain, N. (2025). Apparent Digestibility Coefficients of Selected Plant Protein Feed Ingredients and Feeds for Coho Salmon ( Oncorhynchus kisutch ) Postsmolts Cultured in Fresh Water. Aquaculture Nutrition, 2025(1), 3047597. https://doi.org/10.1155/anu/3047597
- Storebakken, T., Shearer, K. D., Baeverfjord, G., Nielsen, B. G., Åsgård, T., Scott, T., & De Laporte, A. (2000). Digestibility of macronutrients, energy and amino acids, absorption of elements and absence of intestinal enteritis in Atlantic salmon, Salmo salar, fed diets with wheat gluten. Aquaculture, 184(1–2), 115–132. https://doi.org/10.1016/S0044-8486(99)00316-6
- Qiu, X., Nguyen, L., & Davis, D. A. (2018). Apparent digestibility of animal, plant and microbial ingredients for Pacific white shrimp Litopenaeus vannamei. Aquaculture Nutrition, 24(3), 930–939. https://doi.org/10.1111/anu.12629
- Cruz-Suárez, L. E., Nieto-López, M., Guajardo-Barbosa, C., Tapia-Salazar, M., Scholz, U., & Ricque-Marie, D. (2007). Replacement of fish meal with poultry by-product meal in practical diets for Litopenaeus vannamei, and digestibility of the tested ingredients and diets. Aquaculture, 272(1–4), 466–476. https://doi.org/10.1016/j.aquaculture.2007.04.084
- Martín, T. F., Roberto, C. C., Lilia, I. M., Ernesto, G. B., Margarita, H. A., & Armando, R. B. (2010). Apparent digestibility of dry matter, protein, and essential amino acid in marine feedstuffs for juvenile whiteleg shrimp Litopenaeus vannamei. Aquaculture, 308(3–4), 166–173. https://doi.org/10.1016/j.aquaculture.2010.08.021
- Nieto-López, M., Tapia-Salazar, M., Ricque-Marie, D., Villarreal-Cavazos, D., Lemme, A., & Cruz-Suárez, L. E. (2011). Digestibility of different wheat products in white shrimp Litopenaeus vannamei juveniles. Aquaculture, 319(3–4), 369–376. https://doi.org/10.1016/j.aquaculture.2011.06.046
- Martín, T. F., Roberto, C. C., Lilia, I. M., & Ernesto, G. B. (2010). Apparent digestion coefficients for dry matter, protein and essential amino acids in terrestrial ingredients for Pacific shrimp Litopenaeus vannamei (Decapoda: Penaeidae). Revista de Biologia Tropical, 58(4), 1561–1576.
- Argüello-Guevara, W., & Molina-Poveda, C. (2013). Effect of binder type and concentration on prepared feed stability, feed ingestion and digestibility of Litopenaeus vannamei broodstock diets. Aquaculture Nutrition, 19(4), 515–522. https://doi.org/10.1111/anu.12003
- Lin, H., Deng, Y., Zhu, D., Yang, Q., Zhou, X., Tan, B., Feng, L., & Chi, S. (2023). Effects of partially replacing fishmeal with corn gluten meal on growth, feed utilization, digestive enzyme activity, and apparent nutrient digestibility for juvenile white shrimp, Litopenaeus vannamei. Frontiers in Veterinary Science, 10, 1162599. https://doi.org/10.3389/fvets.2023.1162599