Genetic Diversity of Mardi’s Oyster Mushroom Using SSR Markers
Khairun Hisam Nasir1*, Ganisan Krishnen2, Khairul Asfamawi Khulidin2 and Siti Nadrah Abd Hisham 1
*Corresponding author: Khairun Hisam Nasir, Biotechnology and Nanotechnology Research Centre, Malaysian Agricultural Research and Development Institute (MARDI), Persiaran MARDI-UPM, 43400 Serdang, Malaysia; E-mail: hairin@mardi.gov.my
DOI: 10.37722/AAHAE.2026202
Information Board
ISSN 2690-1900
Frequency: Continuous
Format: PDF and HTML
Versions: Online (Open Access)
Language: English
Impact Factor: 4.9
Publish your article not just in PDF and HTML, but also in documentary format. Simply submit your manuscript as usual — we’ll take care of the rest.
Abstract
Oyster Mushroom (Pleurotus pulmonarius) developed by MARDI has a commercial value comparable to commercial oyster mushrooms but facing difficulty for physical identification. In this study, oyster mushroom isolates were subjected to genetic diversity analysis using Simple Sequence Repeats (SSR) marker. A total of 35 SSRs were selected, and PCR optimization was performed. Ten SSR markers were successfully optimized using PCR were amplified on 13 oyster mushrooms. Six polymorphic SSR markers were identified with allele frequencies ranging from 0.1154 to 0.4231, allele numbers from 7 to 16, gene diversity ranging from 0.7781 to 0.9142 and Polymorphic Information Content ranging from 0.7471 to 0.9077. UPGMA dendrogram grouped the 13 oyster mushrooms into 2 groups. These SSR markers can be used as DNA fingerprints to distinguish MARDI oyster mushrooms.
Keywords
MARDI oyster mushroom, simple sequence repeat, fragment analysis, Unweighted pair group method with arithmetic mean (UPGMA) and DNA fingerprinting
Introduction
The global mushroom industry has expanded at an exponential rate in recent years. The growth rate of the mushroom industry is projected to increase by up to 9.7% annually by 2030, with an estimated annual value of approximately RM200 billion (Jamaludin 2025). Notably, the growth of this industry is concentrated in the Asia-Pacific region, particularly in China, Japan, and Malaysia, which collectively accounted for 79% of the global market in 2021 (Jamaludin 2025). Various types of mushrooms can be cultivated commercially in Malaysia according to different agro-climatic conditions. Some are cultivated in highland areas, lowland areas, or under controlled environmental conditions (Mohd Anim, 2014). The oyster mushroom (Pleurotus pulmonaris) is the most popular cultivated and marketed variety for household consumption in Malaysia (Haimid et al., 2013) while white oyster mushroom (Pleurotus florida), split gill mushroom (Schizophyllum commune), wood ear mushroom (Auricularia cornea), and paddy straw mushroom (Volvariella sp.) are among the mushroom species commonly cultivated by local mushroom growers (Rozmiza et al., 2016).
In general, the mushroom industry in Malaysia has strong potential for further development. However, the industry faces several constraints, including low-quality mushroom spawn, insufficient supply of spawn, and unpredictable climatic factors such as fluctuations in temperature, humidity, and air circulation (Rozmiza et al., 2016), all of affect optimal mushroom growth. To address these issues, MARDI has developed a mushroom culture collection through the screening and isolation of more productive isolates (Khairul et al.,2023).
Various mushroom isolates have been identified and obtained from variousness sources such as farmers, research institutions and universities. A total of 96 oyster mushroom isolates were screened resulting in the identification of two new productive oyster mushroom strains, namely Jelira 1 (MP28) and Jelira 2 (MP9), which show strong potential for further development. Both Jelira 1 and Jelira 2 strains recorded shorter cultivation periods to primordia formation and exhibited lower contamination levels compared to commercial oyster mushroom strains (Khairul et al.,2023).
Information on genetic variation among oyster mushroom strains is crucial to ensure accurate identification of the strains used (Sultana et al., 2021). This knowledge contributes to the identification and development of new oyster mushroom strains with higher yield potential and improved quality. To date, oyster mushroom identification has generally relied on morphological characterization methods (Kotadiya et al., 2021). However, this approach has limitations when samples are collected at the mycelial stage, as mushroom growth is incomplete and physiological characteristics are not fully developed. Consequently, morphological characterization cannot be effectively performed under these conditions. Therefore, a rapid, accurate, and reproducible identification method is required. DNA fingerprinting technology based on simple sequence repeat (SSR) DNA markers offers a rapid approach with minimal sample requirements, making it suitable for use at the mycelial stage and unaffected by environmental variation (Kyung Ho et al., 2009) and genetic diversity of commercially cultivated oyster mushrooms (Sunjay et al., 2024). Through this technology, the resulting allele profiles can be used as DNA fingerprints to differentiate and authenticate oyster mushroom strains. SSR markers are suitable for DNA fingerprint development due to their high polymorphism, codominant alleles that allow differentiation between homozygous and heterozygous states, compatibility with polymerase chain reaction (PCR), high reproducibility, and ease of integration with high-throughput equipment (Caetano-Anolles et al., 1997). Therefore, a study evaluating the genetic diversity of MARDI oyster mushrooms using SSR markers was conducted to develop DNA fingerprints for the identification of MARDI oyster mushroom.
Material and methods
Oyster mushroom sample
Total of 13 oyster mushrooms were received from Soil, Water and Fertilizer Research Centre, MARDI. Twelve oyster mushrooms mycelium were grown in liquid form on PDA (Difco™ Potato Dextrose Agar) namely TK, MP9, MP11, MP12, MP22, MP 28, MP 35, MP52, MP53, MP58, MP59, MP 60 and CCTK was in fruiting bodies (table 1). Samples were kept in 4°C before DNA extraction using modified CTAB method (Turaki et al., 2017).
DNA extraction
About 1 g of mycelium after spun mushroom mycelium in liquid PDA at 3000 rpm for 1 min using microcentrifuge or fruiting body of splitgill mushrooms in 2‑mL tube was deep in liquid nitrogen and ground with stainless steel balls to a powder using Tissue Lyser (Qiagen, GmbH Germany). Next, 2000 µL of extraction buffer (final concentration; polyvinylpyrrolidone (PVP) 2%, diethyldithiocarbamate (DIECA), 4 mM, ascorbic acid 5 mM, NaCl 1.4 M, Tris-HCl (pH 8.0) 100 mM and Ethylenedinitrilotetraacetic acid (EDTA) 20 mM) was added to the ground powder. The mixture was incubated at 65°C for 1 hour with intermittent mixing. Then, the mixture was kept at 4°C for 30 minutes prior centrifuged at 5500 rpm for 15 min. The supernatant was transferred into new 2-mL tubes. The same volume of isopropanol was added to this mixture and was homogenized by inverting the tubes. The mixture was centrifuged at 5500 rpm for 15 min. The supernatant was discarded and 1 mL of 70% ethanol was added. Later, the mixture centrifuged at 5500 rpm for 1 min. The DNA was air-dried and re-suspended in 50 μL Tris-EDTA buffer, and the DNA was quantified for concentration using Thermo Labsystems Fluoroskan AscentTM (Thermo Scientific, USA) and DNA integrity was tested on 0.8% agarose gel for quality control.
Table 1. List of mushroom samples
| No. | Sample ID | Number of samples |
| 1 | Tiram kelabu | 1 |
| 2 | MP9 | 1 |
| 3 | MP11 | 1 |
| 4 | MP12 | 1 |
| 5 | MP22 | 1 |
| 6 | MP28 | 1 |
| 7 | MP35 | 1 |
| 8 | MP52 | 1 |
| 9 | MP53 | 1 |
| 10 | MP58 | 1 |
| 11 | MP59 | 1 |
| 12 | MP60 | 1 |
| 13 | CCTK | 1 |
| Total | 13 |
SSR Polymerase Chain Reaction (PCR) for fragment analysis
Total of thirty-five primer pairs (table 2) were used for PCR. SSR marker was tagged with M13 sequence as an adaptor to ligate with a fluorescent dye. The PCR amplification was carried out in a total reaction volume of 10 µL consisting of 1.0 µL of template DNA (approximately 40 ng/µL), 1 µL of PCR reaction buffer, 1.5–3.0 mM MgCl2, 2 mM dNTPs mixtures, 10 µmol of each primer set, 5 µmol of fluorescent dye (FAM/VIC/NED and PET) and 1U of Taq DNA polymerase (Invitrogen, USA). Amplification was performed using a Peltier Thermal Cycler, DNA Engine Tetrad 2 (BioRad, USA). The PCR profile included an initial denaturation at 94 °C for 5 min followed by 34 cycles of the second denaturation at 94 °C for 30 s, annealing temperature (Table 2) for 45 s, extension at 72°C for 45 s, and a final cycle of 72 °C for 7 min. The PCR products were genotyped using the 3730xl DNA Analyzer (Applied Biosystems, USA).
Table 2. List of SSR primer for PCR
| No | Locus | Forward primer | Reverse primer | Annealing temperature |
| 1 | GB-PO-001 | 5′-TGTAAAACGGCCAGTCGCAAGCTACAAACGGAC-3′ | 5′-AGCAGCAAGCACAAGAGC-3′ | 56.0 |
| 2 | GB-PO-006 | 5′-TGTAAAACGGCCAGTTGTGGCAAACCCAAGTTC -3′ | 5′-CCCAAAGGATGAGGAAGG-3′ | 63.0 |
| 3 | GB-PO-011 | 5′-TGTAAAACGGCCAGTTCCCATACCCTGACATCG-3′ | 5′-ATCATCAAGCGCCACAAC-3′ | 54.0 |
| 4 | GB-PO-025 | 5′-TGTAAAACGGCCAGTTGATCATGGCGAGTAGGG-3′ | 5′-GGAACTGTCAGCAGACGC-3′ | 61.1 |
| 5 | GB-PO-026 | 5′-TGTAAAACGGCCAGTAATCGCATGGGCTCTG -3′ | 5′-CTGTCCCTCCGTGTACCA-3′ | 58.0 |
| 6 | GB-PO-028 | 5′-TGTAAAACGGCCAGTCTGGAGAATCGTAGCCCC-3′ | 5′-ACAAGCGCTCGGAATACA-3′ | 54.0 |
| 7 | GB-PO-039 | 5′-TGTAAAACGGCCAGTTGTGGATGTGATGTGATGTG-3′ | 5′-ACGTCCAGCGTCGAGTTA-3′ | 58.3 |
| 8 | GB-PO-050 | 5′-TGTAAAACGGCCAGTCATCCGATACAGACCCGA-3′ | 5′-AGGCATCCCACAACACTG-3′ | 56.0 |
| 9 | GB-PO-051 | 5′-TGTAAAACGGCCAGTCATAGGGACGACAGCGAG-3′ | 5′-ACTGAGCCTTCAGCACCA-3′ | 67.2 |
| 10 | GB-PO-061 | 5′-TGTAAAACGGCCAGTTAACTTGGGCGCTTGAAA-3′ | 5′-TGGAACGCGTAGACTTGG-3′ | 65.4 |
| 11 | GB-PO-064 | 5′-TGTAAAACGGCCAGTGTTCTGAGGGTTGAGGGG-3′ | 5′-CCAACCACACTCTTCCCA-3′ | 56.0 |
| 12 | GB-PO-076 | 5′-TGTAAAACGGCCAGTTCGATTGTCAGATTGTTGGA-3′ | 5′-CGGAGAAGCAGTTGGTTG-3′ | 56.0 |
| 13 | GB-PO-079 | 5′-TGTAAAACGGCCAGTACCCAGACGATTTGGGAG-3′ | 5′-AGGCTGGCGTGGAATACT-3′ | 56.0 |
| 14 | GB-PO-080 | 5′-TGTAAAACGGCCAGTCACCCATGTGCCTCAGTC-3′ | 5′-TGTCTATGGGTTACGGCG-3′ | 55.0 |
| 15 | GB-PO-086 | 5′-TGTAAAACGGCCAGTCATCTTCGATGAACCGGA-3′ | 5′-CGAAGATGAGCCAGCAAC-3′ | 64.4 |
| 16 | GB-PO-094 | 5′-TGTAAAACGGCCAGTCGCGAGACAATTAAACGC-3′ | 5′-ACAGTTCCTGGAGCCCAT-3′ | 56.0 |
| 17 | GB-PO-097 | 5′-TGTAAAACGGCCAGTCATGGAGAGAGGGCGG-3′ | 5′-CGTTTCATCGTTCGCTGT-3′ | 61.1 |
| 18 | GB-PO-102 | 5′-TGTAAAACGGCCAGTTGTCTATGGGTTACGGCG-3′ | 5′-TGCAAAGCAAATCGGAAC-3′ | 56.0 |
| 19 | GB-PO-113 | 5′-TGTAAAACGGCCAGTGTTCATCTGAACGCCGTC-3′ | 5′-CCTATGACGAGGGGAAGG-3′ | 61.1 |
| 20 | GB-PO-115 | 5′-TGTAAAACGGCCAGTTGGTAGCAGGTTGTTGGG -3′ | 5′-CCGCTAAGCCACTGTTTG-3′ | 55.0 |
| 21 | GB-PO-117 | 5′-TGTAAAACGGCCAGTTCAAACTCACGTGGTACGC-3′ | 5′-TCACATATCCGCCGGTAG-3′ | 55.0 |
| 22 | GB-PO-124 | 5′-TGTAAAACGGCCAGTTGCGTTTGCTCGGTTAAT-3′ | 5′-CGCTACTACGTCGATCCG-3′ | 58.0 |
| 23 | GB-PO-128 | 5′-TGTAAAACGGCCAGTTGATTGGTTTGAATGGGC-3′ | 5′-GCACGATGAGGATGCAGT -3′ | 63.0 |
| 24 | GB-PO-131 | 5′-TGTAAAACGGCCAGTCTCCCTCCTCCGTGTACC-3′ | 5′-CGTAACGTTCGCTTCCTG-3′ | 56.0 |
| 25 | GB-PO-134 | 5′-TGTAAAACGGCCAGTGAGTGTGAAGAATCGGCG-3′ | 5′-GTGCACTCTGCCTATCGC-3′ | 58.0 |
| 26 | GB-PO-135 | 5′-TGTAAAACGGCCAGTAGGAGGGGGTGCTTGATA-3′ | 5′-TCCTCCGCCTTCTCTACC-3′ | 55.0 |
| 27 | GB-PO-138 | 5′-TGTAAAACGGCCAGTTATGGAACGGTGCGAAGT-3′ | 5′-GCCGTCAAAAGGGAACTC-3′ | 58.0 |
| 28 | GB-PO-149 | 5′-TGTAAAACGGCCAGTAGTGCATATGCCCGACAC-3′ | 5′-CGTCGTAGATGCAGGCTC-3′ | 58.0 |
| 29 | GB-PO-152 | 5′-TGTAAAACGGCCAGTACTGAGCCTTCAGCACCA-3′ | 5′-CATAGGGACGACAGCGAG-3′ | 58.0 |
| 30 | GB-PO-154 | 5′-TGTAAAACGGCCAGTGTCGTAGCCAGCCATGAG-3′ | 5′-AGGGTATCTCGGGTGCAT-3′ | 67.2 |
| 31 | GB-PO-157 | 5′-TGTAAAACGGCCAGTATGGACGTGGTGTTCTGC-3′ | 5′-ACGTCAGGGTGTCAAACG-3′ | 58.3 |
| 32 | GB-PO-171 | 5′-TGTAAAACGGCCAGTTCTCGGGCATCATTCTTG-3′ | 5′-ACGTCAGGGTGTCAAACG-3′ | 56.0 |
| 33 | GB-PO-172 | 5′-TGTAAAACGGCCAGTGCAGAAGTTGCCCAAAGA-3′ | 5′-ATGTCCAGCGGAAGACCT-3′ | 44.8 |
| 34 | GB-PO-181 | 5′-TGTAAAACGGCCAGTTTATTGTGAAGCCCCCG-3′ | 5′-GACATCGGCAGAAGGTCA-3′ | 65.0 |
| 35 | GB-PO-190 | 5′-TGTAAAACGGCCAGTTTTCCATTTCCGTTGGTG-3′ | 5′-CAGGGGGTGATTATGCAA-3′ | 61.1 |
Scoring and data analysis
The allele for each of the oyster mushroom was analyzed using the GeneMapper 5.0 software (Applied Biosystems). GS500LIZ was used as the standard control. The allele peaks in the electropherograms were scored and analyzed (Arif et al. 2010). Only unambiguous peaks were used in the analysis. The data were pre-analyzed using MicroChecker v2.2.3 (Van Oosterhout et al. 2004) to confirm the presence of null alleles, large allele dropout, and scoring errors due to stutter peaks. The peaks scored were imported into a Microsoft Excel file. PowerMarker v3.25 was used to calculate the number of alleles, heterozygosities and Nei’s genetic distance (Liu et al., 2005). MEGA 7 (Kumar et al., 2016) was used to visualize the dendogram based on genetic distance generate by PowerMarker.
Result and discussion
Total of 35 primer SSR has been used for PCR optimization and only 10 primers were successfully produced amplified product. The succeed optimized PCR products were used for fragment analysis using ABI3730XL. Out of 10 SSR only 6 SSRs were produced polymorphic whereas the remaining 4 SSR loci showed multi banding patterns, monomorphic bands, and low allele calls. These polymorphic SSRs were tested on 13 oyster samples. Allele frequency ranges from 0.1154 (marker GB-PO-025) to 0.4231 (marker GB-PO-006) with an average 0.2885 (Table 3).
Allele frequency reflects the relative presence of alleles in each individual oyster mushroom, which is a unique allele for each mushroom individual that can be used to identify the mushroom. Meanwhile, the number of alleles ranges from 7 to 16 with an average of 10.6667 showing the number of alleles in each primer, which reflects genetic diversity. Primers with high genetic diversity values are able to distinguish oyster mushrooms (Table 3).
Gene diversity ranges from 0.7781 to 0.9142 with an average 0.8289 shows the probability of the difference between two alleles taken at random from a mushroom population. A high genetic diversity value (approaching 1) indicates high allelic diversity and is very helpful in distinguishing oyster mushroom individuals. On the other hand, a low genetic diversity value (approaching 0) indicates low allelic diversity which indicates low allelic information in distinguishing oyster mushroom individuals. Similar studied have demonstrated SSR markers was able to differentiate oyster mushroom species with highest genetic similarity was observed between P. ostreatus and P. pulmonarius with specific SSR markers namely PoM912, PoM913, and PoM914 (Sanjey et al., 2024). These primers showed strong discriminatory power and revealed substantial polymorphism among the species.
Polymorphic information content (PIC) ranges from 0.7471 to 0.9077 with an average 0.8110 (Table 3). The PIC value reflects the ability of the SSR marker to detect genetic differences in the tested mushroom population. The PIC value has a value ranging from 0 to 1. If the PIC value is less than 0.25, it indicates that the marker is less informative, a PIC value between 0.25 and 0.5 indicates that the marker is moderately informative, and a PIC value greater than 0.5 indicates that the marker is highly informative, which is very useful in detecting the genetic diversity of oyster mushrooms.
Table 3. Analysis of 6 polymorphic SSR markers
| No | Marker | Allele Frequency | Allele No | Gene Diversity | Heterozygosity | PIC |
| 1 | GB-PO-006 | 0.4231 | 10.0000 | 0.7692 | 0.6154 | 0.7488 |
| 2 | GB-PO-025 | 0.1154 | 14.0000 | 0.9142 | 0.6154 | 0.9077 |
| 3 | GB-PO-039 | 0.3077 | 7.0000 | 0.7781 | 1.0000 | 0.7471 |
| 4 | GB-PO-080 | 0.3077 | 8.0000 | 0.8047 | 0.6923 | 0.7792 |
| 5 | GB-PO-097 | 0.1923 | 16.0000 | 0.9053 | 0.9231 | 0.8984 |
| 6 | GB-PO-173 | 0.3846 | 9.0000 | 0.8018 | 0.7692 | 0.7848 |
| Mean | 0.2885 | 10.6667 | 0.8289 | 0.7692 | 0.8110 |
Six polymorphic SSR primers were used to generate a phylogenetic tree using genetic distance data from the analysis results obtained using PowerMarker software which ranged from 0.000 to 1.0000 (Table 4). If the genetic distance value between oyster mushroom individuals was the same, then they were grouped into the same group. Two groups were generated based on the genetic distance of oyster mushroom individuals, group 1 consisted of MP59 and MP60 (having the same genetic distance of 0.25) (Figure 1). While group II can be divided into two subgroups, namely subgroup IIa consisting of MP9 (genetic distance 0.17), MP12 (genetic distance 0.13), MP28 (genetic distance 0.13), CCTK (genetic distance 0.17), MP53 (genetic distance 0.17), MP35 (genetic distance 0.23), MP52 (genetic distance 0.17) and TK (genetic distance 0.17), while subgroup IIb consists of MP58 (genetic distance 0.33), MP11 (genetic distance 0.08) and MP22 (genetic distance 0.08) (Figure 1). The difference between subgroups IIa and IIb has a genetic distance difference of 0.01. Similar molecular diversity and polymorphism analysis involving five Pleurotus species was conducted using seven SSR primers. The study revealed varying levels of genetic differentiation among the species, with Nei’s genetic distance ranging from 0.44 to 0.73. The highest genetic distance (0.73) was observed between P. ostreatus, P. florida, and P. pulmonarius when compared with the other species, whereas the lowest genetic distance was recorded at 0.44. These findings indicate the presence of both closely related and genetically distinct species within the Pleurotus genus, demonstrating the effectiveness of SSR markers in assessing genetic diversity and species relationships (Sanjay et al., 2024).
The biological comparison between subgroup IIa and subgroup IIb is the biological characteristics of producing large and heavy fruits (subgroup IIa) compared to medium fruits (subgroup IIb), curved cap structure (subgroup IIa) compared to flat cap (subgroup IIb) and production cycle between 45 days (subgroup IIa) compared to 60 days (subgroup IIb). The industrial implications of oyster mushrooms subgroup IIa provide high production compared to subgroup IIb. The difference between groups I and II has a genetic distance of 0.23. The biological comparison between groups I and group II is that group I is a unique oyster mushroom while group II is a common oyster mushroom that represents commercial oyster mushrooms. With the phylogenetic tree of oyster mushrooms, each individual oyster mushroom is grouped according to the genetic similarities and differences resulting from the SSR primer that can be used for DNA fingerprinting.
For example, the SSR primer GB-PO-025 produces a unique allele for TK (162bp/0bp), MP9 (195bp/250bp), MP12 (114bp/195bp), MP28 (112bp/195bp), MP35 (119bp/250bp), MP11 (109bp/223bp), MP22 (223bp/250bp), MP52 (115bp/0bp), MP53 (120bp/145bp), MP58 (133bp/0bp), MP59 (129bp/202bp) and GB_PO-051 produces a unique allele for MP60 (129bp/146bp) and CCTK (110bp7126bp) respectively (Table 5).
Current practice for identification of improved MARDI oyster mushroom was through physical morphology. The disadvantages of these techniques required experience personal for characterization and surrounding environment affect the physical appearance of oyster mushroom. To overcome this problem, we developed DNA fingerprinting using 10 SSR markers namely GB-PO-006, GB-PO-025, GB-PO-039, GB-PO-051, GB-PO-080, GB-PO-086, GB-PO-097, GB-PO-128, GB-PO-173 and GB-PO-190 (Table 5) were able to different 13 oyster mushrooms.
These finding may apply in commercial mushroom production by using DNA fingerprinting that enables accurate strain identification, verification of spawn purity, protection of proprietary mushroom, and prevention of strain mislabeling or contamination. These applications contribute to improved production consistency, quality control, and traceability throughout the cultivation process. Furthermore, DNA fingerprinting supports agricultural sustainability by facilitating the conservation and efficient utilization of genetic resources, promoting the development of superior strains with enhanced yield and reducing losses associated with poor-quality or genetically mixed spawn.
Table 4. Genetic distance of 13 oyster mush rooms, CCTK, MP11, MP12, MP22, MP28, MP35, MP52, MP53, MP58, MP59, MP60, MP9 and TK
| No | OUT | CCTK | MP11 | MP12 | MP22 | MP28 | MP35 | MP52 | MP53 | MP58 | MP59 | MP60 | MP9 | TK |
| 1 | CCTK | 0.0000 | 1.0000 | 0.5833 | 1.0000 | 0.5833 | 0.5000 | 0.5000 | 0.3333 | 1.0000 | 1.0000 | 1.0000 | 0.5000 | 0.5833 |
| 2 | MP11 | 1.0000 | 0.0000 | 0.9167 | 0.1667 | 1.0000 | 1.0000 | 1.0000 | 1.0000 | 0.6667 | 1.0000 | 1.0000 | 1.0000 | 0.9167 |
| 3 | MP12 | 0.5833 | 0.9167 | 0.0000 | 1.0000 | 0.2500 | 0.5833 | 0.5833 | 0.5000 | 1.0000 | 1.0000 | 1.0000 | 0.3333 | 0.5833 |
| 4 | MP22 | 1.0000 | 0.1667 | 1.0000 | 0.0000 | 1.0000 | 0.9167 | 1.0000 | 1.0000 | 0.6667 | 1.0000 | 1.0000 | 0.9167 | 0.9167 |
| 5 | MP28 | 0.5833 | 1.0000 | 0.2500 | 1.0000 | 0.0000 | 0.5833 | 0.5833 | 0.5000 | 1.0000 | 1.0000 | 1.0000 | 0.3333 | 0.5833 |
| 6 | MP35 | 0.5000 | 1.0000 | 0.5833 | 0.9167 | 0.5833 | 0.0000 | 0.5000 | 0.5000 | 1.0000 | 1.0000 | 0.9167 | 0.5000 | 0.4167 |
| 7 | MP52 | 0.5000 | 1.0000 | 0.5833 | 1.0000 | 0.5833 | 0.5000 | 0.0000 | 0.4167 | 1.0000 | 1.0000 | 1.0000 | 0.4167 | 0.4167 |
| 8 | MP53 | 0.3333 | 1.0000 | 0.5000 | 1.0000 | 0.5000 | 0.5000 | 0.4167 | 0.0000 | 1.0000 | 1.0000 | 1.0000 | 0.4167 | 0.5833 |
| 9 | MP58 | 1.0000 | 0.6667 | 1.0000 | 0.6667 | 1.0000 | 1.0000 | 1.0000 | 1.0000 | 0.0000 | 1.0000 | 1.0000 | 1.0000 | 0.9167 |
| 10 | MP59 | 1.0000 | 1.0000 | 1.0000 | 1.0000 | 1.0000 | 1.0000 | 1.0000 | 1.0000 | 1.0000 | 0.0000 | 0.5000 | 1.0000 | 1.0000 |
| 11 | MP60 | 1.0000 | 1.0000 | 1.0000 | 1.0000 | 1.0000 | 0.9167 | 1.0000 | 1.0000 | 1.0000 | 0.5000 | 0.0000 | 1.0000 | 1.0000 |
| 12 | MP9 | 0.5000 | 1.0000 | 0.3333 | 0.9167 | 0.3333 | 0.5000 | 0.4167 | 0.4167 | 1.0000 | 1.0000 | 1.0000 | 0.0000 | 0.5000 |
| 13 | TK | 0.5833 | 0.9167 | 0.5833 | 0.9167 | 0.5833 | 0.4167 | 0.4167 | 0.5833 | 0.9167 | 1.0000 | 1.0000 | 0.5000 | 0.0000 |
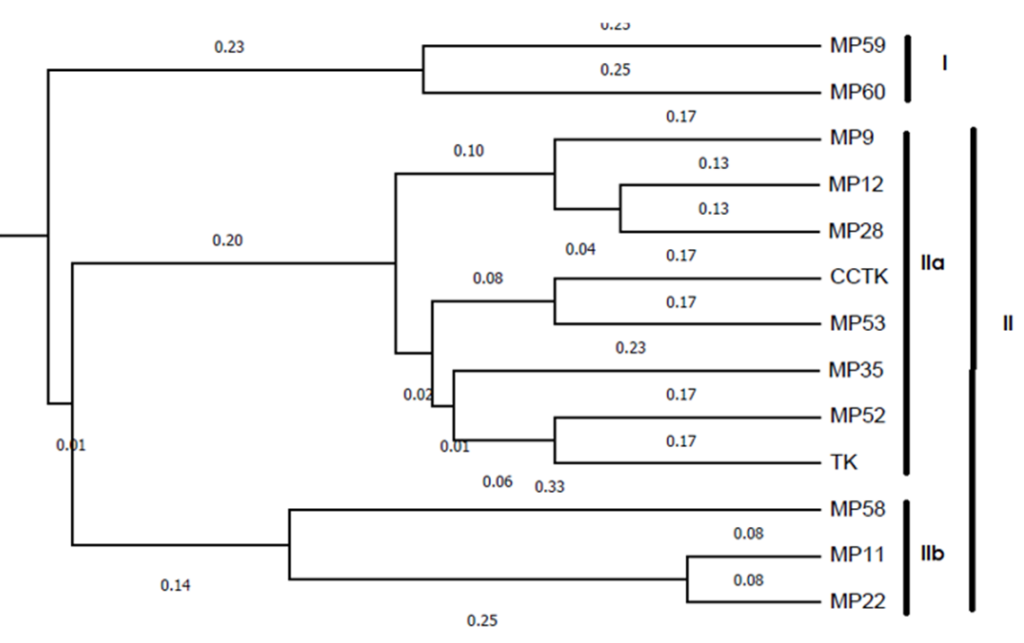
Table 5. List of 10 SSR markers, GB-PO-006, GB-PO-025, GB-PO-039, GB-PO-051, GB-PO-080, GB-PO-086, GB-PO-097, GB-PO-128, GB-PO-173, and GB-PO-190 that can be used to differentiate 13 oyster mushrooms.
| No | Sample Name | SSR MARKER (bp) | ||||||||||||||||||||
| GB-PO-006 | GB-PO-025 | GB-PO-039 | GB-PO-051 | GB-PO-080 | GB-PO-086 | GB-PO-097 | GB-PO-128 | GB-PO-173 | GB-PO-190 | |||||||||||||
| 1 | TK | 113 | 197 | 162 | 0 | 164 | 226 | 61 | 0 | 222 | 243 | 70 | 118 | 126 | 208 | 254 | 0 | 112 | 170 | 102 | 0 | |
| 2 | MP9 | 113 | 197 | 195 | 250 | 164 | 226 | 112 | 0 | 222 | 232 | 70 | 194 | 222 | 0 | 103 | 106 | 112 | 193 | 102 | 286 | |
| 3 | MP12 | 113 | 127 | 114 | 195 | 164 | 226 | 88 | 246 | 222 | 232 | 70 | 194 | 221 | 224 | 177 | 254 | 112 | 193 | 102 | 286 | |
| 4 | MP28 | 113 | 233 | 112 | 195 | 164 | 226 | 81 | 85 | 222 | 232 | 65 | 84 | 221 | 239 | 106 | 254 | 112 | 193 | 102 | 145 | |
| 5 | MP35 | 113 | 0 | 119 | 250 | 164 | 226 | 230 | 0 | 222 | 243 | 70 | 194 | 168 | 235 | 110 | 254 | 112 | 170 | 102 | 145 | |
| 6 | MP11 | 178 | 0 | 109 | 223 | 104 | 148 | 75 | 90 | 165 | 0 | 98 | 252 | 208 | 224 | 178 | 0 | 120 | 191 | 100 | 244 | |
| 7 | MP22 | 178 | 0 | 223 | 250 | 104 | 148 | 75 | 90 | 165 | 0 | 252 | 0 | 161 | 208 | 103 | 106 | 120 | 191 | 100 | 0 | |
| 8 | MP52 | 113 | 197 | 115 | 0 | 164 | 226 | 0 | 0 | 222 | 243 | 70 | 0 | 174 | 222 | 0 | 0 | 112 | 0 | 101 | 0 | |
| 9 | MP53 | 113 | 0 | 120 | 145 | 164 | 226 | 108 | 0 | 222 | 232 | 70 | 194 | 135 | 222 | 106 | 254 | 112 | 0 | 102 | 0 | |
| 10 | MP58 | 156 | 299 | 133 | 0 | 104 | 149 | 75 | 90 | 165 | 0 | 252 | 0 | 208 | 228 | 102 | 246 | 179 | 0 | 100 | 208 | |
| 11 | MP59 | 101 | 167 | 129 | 202 | 235 | 260 | 171 | 0 | 135 | 144 | 67 | 75 | 207 | 276 | 107 | 259 | 142 | 274 | 106 | 119 | |
| 12 | MP60 | 101 | 106 | 129 | 0 | 235 | 260 | 128 | 146 | 172 | 0 | 276 | 286 | 168 | 196 | 106 | 259 | 142 | 274 | 101 | 0 | |
| 13 | CCTK | 113 | 0 | 120 | 0 | 164 | 226 | 110 | 126 | 177 | 222 | 70 | 194 | 133 | 222 | 106 | 0 | 112 | 147 | 102 | 145 | |
Conclusion
Ten out of thirty-six simple sequence repeat (SSR) primers were successfully optimised for DNA fingerprinting analysis of oyster mushroom accessions at MARDI. Among these, six SSR primers generated polymorphic alleles and were subsequently employed for phylogenetic analysis. The resulting phylogenetic tree separated the oyster mushroom accessions into two major groups. Group I comprised MP59 and MP60, while Group II was further divided into two subgroups, IIa and IIb. Subgroup IIa included MP9, MP12, MP28, CCTK, MP53, MP35, MP52, and TK, whereas Subgroup IIb consisted of MP58, MP11, and MP22. Accurate identification of oyster mushroom accessions using DNA fingerprinting was achieved using six SSR primers, namely GB-PO-006, GB-PO-025, GB-PO-039, GB-PO-080, GB-PO-097, and GB-PO-173. DNA fingerprinting provides a robust molecular tool to complement morphological characterisation of oyster mushrooms. Furthermore, this approach enables the assessment of genetic purity of oyster mushroom spawn, facilitating the detection of contamination caused by the mixing of inferior or heterogeneous spawn materials, and thereby contributing to improved productivity and quality assurance within the mushroom industry. This finding also supports the use of SSR markers as effective tools for molecular characterization and genetic diversity assessment in of edible mushrooms. Understanding genetic relationships among cultivated strains can help breeders develop improved varieties with desirable traits.
Acknowledgements: The authors express their gratitude to Soil Science, Water and Fertilizer Research Centre, MARDI for providing material and funded this research.
References
- Arif, I. A., Khan, H. A., Shobrak, M., Al Homaidan, A. A., Al Sadoon, M., Al Farhan, A. H. and Bahkali, A. H. Interpretation of Electrophoretograms of Seven Microsatellite Loci to Determine the Genetic Diversity of the Arabian Oryx. Genetics and Molecular Research, vol. 9 (1), pp. 259–65, 2010.
- Caetano-Anolles, G. and Gresshoff, P. M. DNA markers: protocols, applications, and overviews. Wiley-Vch, N.Y, 1997.
- Haimid, M. T., Rahim, H., and Dardak, R. A. Understanding the mushroom industry and its marketing strategies for fresh produce in Malaysia. Economic and Technology Management Review, vol 8, pp. 27–37, 2013.
- Jamaludin, M. R. Industri Cendawan dunia. Agrimag, 30, pp 8-13, 2025.
- Khairul, A, K., Ganisan, K., Mohd, Z. M. A., Ten, S. T., Haryati, M., Musaalbakri, A. M., Ahmad, F. B., Syaliyana, K., & Abu, B. O..SCIPe MARDI: Pakej lengkap untuk industri cendawan tempatan.Buletin Teknologi MARDI, Bil, 36, pp 153 – 166, 2023.
- Kotadiya, U., Talaviya, J., Shah, K. and Lathiya, S. Morphological and molecular identification of oystermushroom [Pleurotus ostreatus(Jacq.)P.Kumm]. Research square, 2021.
- Kumar, S., Stecher, G., & Tamura, K. MEGA7: molecular evolutionary genetics analysis version 7.0 for bigger datasets. Molecular biology and evolution, vol 33(7), pp. 1870-1874, 2016.
- Liu, K. and Muse, S.V. PowerMarker: an integrated analysis environment for genetic marker analysis. Bioinformatics, vol. 21, pp. 2128–2129, 2005.
- Mohd Anim, A. Competitiveness of the mushroom industry in Malaysia. FFTC Agricultural Policy Platform, 2014.
- Kyung, H., Gi, A. L., Sok, Y. Lee., Jae, G. G., Tae, S. K., Won, S. K., Kyoung, I. Seo., Gang, S. Lee. and Yong, J. P. Development and Characterization of New Microsatellite Markers for the Oyster Mushroom (Pleurotus ostreatus). J. Microbiol. Biotechnol.vol 19(9), pp 851–857, 2009.
- Sanjay, K.B., Hemant, S., Vinay, P. and Bamleshwar Sapre. International Journal of Plant & Soil Science. Vol 36(12), pp 537-543, 2024.
- Rosmiza M. Z., Davies, W.P., Rosniza A. C.R., Jabil M. J. Prospects for Increasing Commercial Mushroom Production in Malaysia: Challenges and Opportunities. Mediterranean Journal of Social Sciences, vol 7, pp. 406 -415, 2016.
- Sultana, A., Sarker, N. C., Kakon, A. J., Syed, S. B., Elahi, M. T., Biswas, S. K., Tang, S.-S., Rahman, A., and Paul, D. K. Comparison of major nutritional constituents and genetic diversity analysis of five strains of oyster mushrooms. Journal of Advanced Biotechnology and Experimental Therapeutics, vol 4(3), pp 405–414, 2021.
- Turaki, A.A., Ahmad, B., Magaji, U.F., Abdulrazak, U.K., Yusof, B.A. and Hamza, A.B. Optimised cetyltrimethylammonium bromide (CTAB) DNA extraction method of plant leaf with high polysaccharide and polyphenolic compounds for downstream reliable molecular analyses. African Journal of Biotechnology, vol 16(24), pp1354-1365, 2017.
- Van Oosterhout, C., Hutchinson, F.W., Wills, P.D. and Shipley, P. MICRO‐CHECKER: software for identifying and correcting genotyping errors in microsatellite data. Molecular Ecology Notes, 4, pp 535–538, 2004.